PKC epsilon controls the traffic of beta1 integrins in motile cells - PubMed (original) (raw)
PKC epsilon controls the traffic of beta1 integrins in motile cells
Johanna Ivaska et al. EMBO J. 2002.
Abstract
Protein kinase C (PKC) has been implicated in beta 1 integrin-mediated cell migration. Expression of the novel PKC isoform, PKC epsilon, in PKC epsilon(-/-) cells is shown here to stimulate directional migration of cells towards beta 1 integrin substrates in a manner dependent on PKC catalytic activity. On PKC inhibition, integrin beta 1 and PKC epsilon become reversibly trapped in a tetraspanin (CD81)-positive intracellular compartment, correlating with reduced haptotaxis. Immunofluorescence and pulse labelling studies indicate that this is a previously uncharacterized recycling compartment trapped by inhibition of PKC. Electron microscopy demonstrated the co-localization of PKC epsilon and integrin beta 1 on the vesicular membranes. Finally, using a reconstituted in vitro system, the dissociation of PKC epsilon from these vesicles is shown to be dependent on both the presence of cytosolic components and energy, and on PKC catalytic activity. The evidence presented indicates that PKC epsilon controls an internal traffic step that under uninhibited conditions permits the recycling of beta 1 integrin, contributing to cell motility.
Figures
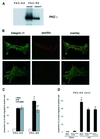
Fig. 1. PKC-driven changes in integrin-controlled functions. (A) MEFs from a PKCε–/– embryo were isolated and isogenic lines established by transfection with PKCε (PKCεRE) or control vector (PKCεKO). The level of PKCε in two different isolates (clone 5 and 17) is shown; no PKCε is detected in the vector control line. (B) The focal adhesions of PKCεKO (top panels) and PKCεRE (lower panels) cells plated on fibronectin (FN). Immunofluorescence staining of β1 integrin (green) and paxillin (red) is shown as representative confocal images of 0.8 µm sections taken from the basal side of the cell. The bar represents 10 µm. (C) PKCε expression enhances haptotactic response towards FN. The bottom of Transwell filters was coated using 10 µg/ml BSA or FN. Serum-starved PKCεKO and PKCεRE cells were allowed to migrate in the absence or presence of the PKC inhibitor BIM I (1 µM) for 24 h. The cells on different sides of the filter were trypsinized and counted. Shown are the precentage of cells that had migrated to the bottom well (mean ± SEM, n = 8). The data were analysed using the _t_-test in order to assess statistical significance (*, difference between PKCεKO and PKCεRE cell migration towards FN, p = 0.04; **, difference between PKCεRE cells migrating towards FN ± BIM I, p = 0.005). (D) Kinase-dead PKCε fails to enhance haptotactic response towards FN. PKCεKO cells were transiently transfected with GFP–PKCε or GFP–PKCεK/M for 24 h before preparation for Transwell assay. As above, the cells were allowed to migrate for 24 h. The cells on different sides of the filter were trypsinized, fixed, transferred to microscope slides by cytospin and 50 fields of each slide were scored for GFP-positive and non-transfected cells. Shown are the percentages of GFP-positive or non-transfected cells that had migrated to the bottom well (mean ± SEM, three separate experiments). The data were analysed using the _t_-test in order to assess statistical significance (*, difference between migration of GFP–PKCε-positive PKCεKO cells and non-transfected and PKCεKO cells towards FN, p = 0.04).
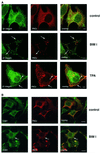
Fig. 2. Modulation of PKCε activity alters the cellular localization of β1 integrin. (A) Immunofluorescence staining of β1 integrin (green) and PKCε (red) in PKCεRE clone 5 cells are shown as representative confocal images of 0.8 µm sections. The cells were plated and allowed to spread on fibronectin for 30 min, following a further 90 min incubation either untreated (top), treated with 1 µM BIM I (middle) or stimulated with 200 nM TPA (bottom). The bar represents 10 µm. The immunofluorescence images suggest that in PKCεRE cells there is co-localization between β1 integrin and PKCε in membrane ruffles upon stimulation, or at specific vesicles following inhibition of PKC. Examples of these sites of co-localization are indicated with arrows. (B) Accumulating PKCε positive vesicles co-localize with the tetraspanin CD81. Immunofluorescence staining of CD81 (green) and PKCε (red) in PKCεRE clone 5 cells treated as above is shown as representative confocal images of 0.8 µm sections. Significant overlap of CD81- and PKCε-positive vesicles is observed in BIM I-treated cells. Examples of these sites of co-localization are indicated with arrows. (C) The lack of co-localization between β1 integrin (green) and β-COP (red, Golgi complex) or KDELR (red, endoplasmic reticulum) and PKCε (red) and P115 (green, Golgi complex) in BIM I-treated clone 5 cells indicates that the vesicles do not originate from the Golgi or the endoplasmic reticulum. (D) BIM I induces significant accumulation of β1 integrin in vesicles only in PKCεRE cells. PKCεKO and PKCεRE cells were treated with 1 µM BIM I as in (A). Staining for β1 integrin is shown in green. In the lower panel is the quantitation of the vesicular phenotype of BIM I-treated PKCεRE and PKCεKO cells scored from eight randomly selected fields each containing ∼10 cells. The vesicles observed were designated small (diameter < 500 nm) or large (diameter > 500 nm).
Fig. 2. Modulation of PKCε activity alters the cellular localization of β1 integrin. (A) Immunofluorescence staining of β1 integrin (green) and PKCε (red) in PKCεRE clone 5 cells are shown as representative confocal images of 0.8 µm sections. The cells were plated and allowed to spread on fibronectin for 30 min, following a further 90 min incubation either untreated (top), treated with 1 µM BIM I (middle) or stimulated with 200 nM TPA (bottom). The bar represents 10 µm. The immunofluorescence images suggest that in PKCεRE cells there is co-localization between β1 integrin and PKCε in membrane ruffles upon stimulation, or at specific vesicles following inhibition of PKC. Examples of these sites of co-localization are indicated with arrows. (B) Accumulating PKCε positive vesicles co-localize with the tetraspanin CD81. Immunofluorescence staining of CD81 (green) and PKCε (red) in PKCεRE clone 5 cells treated as above is shown as representative confocal images of 0.8 µm sections. Significant overlap of CD81- and PKCε-positive vesicles is observed in BIM I-treated cells. Examples of these sites of co-localization are indicated with arrows. (C) The lack of co-localization between β1 integrin (green) and β-COP (red, Golgi complex) or KDELR (red, endoplasmic reticulum) and PKCε (red) and P115 (green, Golgi complex) in BIM I-treated clone 5 cells indicates that the vesicles do not originate from the Golgi or the endoplasmic reticulum. (D) BIM I induces significant accumulation of β1 integrin in vesicles only in PKCεRE cells. PKCεKO and PKCεRE cells were treated with 1 µM BIM I as in (A). Staining for β1 integrin is shown in green. In the lower panel is the quantitation of the vesicular phenotype of BIM I-treated PKCεRE and PKCεKO cells scored from eight randomly selected fields each containing ∼10 cells. The vesicles observed were designated small (diameter < 500 nm) or large (diameter > 500 nm).
Fig. 2. Modulation of PKCε activity alters the cellular localization of β1 integrin. (A) Immunofluorescence staining of β1 integrin (green) and PKCε (red) in PKCεRE clone 5 cells are shown as representative confocal images of 0.8 µm sections. The cells were plated and allowed to spread on fibronectin for 30 min, following a further 90 min incubation either untreated (top), treated with 1 µM BIM I (middle) or stimulated with 200 nM TPA (bottom). The bar represents 10 µm. The immunofluorescence images suggest that in PKCεRE cells there is co-localization between β1 integrin and PKCε in membrane ruffles upon stimulation, or at specific vesicles following inhibition of PKC. Examples of these sites of co-localization are indicated with arrows. (B) Accumulating PKCε positive vesicles co-localize with the tetraspanin CD81. Immunofluorescence staining of CD81 (green) and PKCε (red) in PKCεRE clone 5 cells treated as above is shown as representative confocal images of 0.8 µm sections. Significant overlap of CD81- and PKCε-positive vesicles is observed in BIM I-treated cells. Examples of these sites of co-localization are indicated with arrows. (C) The lack of co-localization between β1 integrin (green) and β-COP (red, Golgi complex) or KDELR (red, endoplasmic reticulum) and PKCε (red) and P115 (green, Golgi complex) in BIM I-treated clone 5 cells indicates that the vesicles do not originate from the Golgi or the endoplasmic reticulum. (D) BIM I induces significant accumulation of β1 integrin in vesicles only in PKCεRE cells. PKCεKO and PKCεRE cells were treated with 1 µM BIM I as in (A). Staining for β1 integrin is shown in green. In the lower panel is the quantitation of the vesicular phenotype of BIM I-treated PKCεRE and PKCεKO cells scored from eight randomly selected fields each containing ∼10 cells. The vesicles observed were designated small (diameter < 500 nm) or large (diameter > 500 nm).
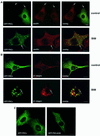
Fig. 3. Cellular localization of GFP–PKCε and paxillin in PKCεKO cells. (A) PKCεKO cells were transiently transfected with GFP–PKCε for 24 h before preparation for microscopy. The cells were plated and allowed to spread on fibronectin for 30 min, followed by a further 90 min incubation either untreated (top) or treated with 1 µM BIM I (bottom). Representative confocal images showing 0.8 µm sections of cells positive or negative for GFP–PKCε also stained with anti-paxillin mAb (red) are shown. The bar represents 10 µm. PKCε decreases the number of prominent focal adhesions detected with paxillin staining (arrows, top) and confirms the accumulation of PKCε in vesicles upon BIM I treatment (arrows, bottom). Note that paxillin is not localized to the GFP–PKCε-positive vesicles but is present in distinct vesicular structures. (B) Integrin β1 co-localizes with GFP–PKCε in vesicles observed in PKCεKO cells upon BIM I treatment. Cells were transfected, plated on fibronectin and either left untreated (top) or treated with BIM I (bottom) as above. Shown are confocal images of cells positive for GFP–PKCε and stained with anti-integrin mAb (red). Examples of sites of co-localization are indicated with arrows. (C) Kinase-dead mutant of GFP–PKCε is expressed in vesicles in untreated cells. PKCεKO cells were transfected with GFP–PKCε or GFP–PKCεK/M for 36 h before preparation for microscopy.
Fig. 4. The effect of BIM I treatment on the recycling of β1 integrins. Cells were surface labelled, and internalization was allowed to proceed for 15 min at 37°C, followed by 15 min at 37°C in the presence or absence of 1 µM BIM I. Biotin was removed from receptors remaining on the cell surface by treatment with MesNa at 4°C. Cells were then rewarmed to 37°C for the times indicated in the presence or absence of 1 µM BIM I, to allow recycling to the plasma membrane, followed by a second reduction with MesNa. Cells were lysed, and β1 integrins were immunoprecipitated and analysed by 6% SDS–PAGE under non-reducing conditions, followed by western blotting with peroxidase-conjugated avidin. The positions of the β1 integrin and the associated α-subunits are indicated. As controls, cells were either lysed after the labelling without MesNa reduction, to determine the amount of total biotinylated integrin (total, –), or lysed after the first reduction before internalization, to control the efficiency of the MesNa reduction (total, +).
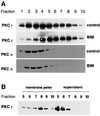
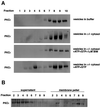
Fig. 5. BIM I treatment induces accumulation of active, membrane-associated PKCε in a dense compartment. (A) PKCεRE cells were treated for 90 min with BIM I (1 µM) or left untreated, followed by a sucrose gradient fractionation (see Materials and methods). The proteins in the fractions were recovered by TCA precipitation and subjected to western blot analysis. Upon BIM I treatment, PKCε was found to accumulate in a dense compartment (fractions 7–9). Note that PKCα does not co-sediment with PKCε even upon BIM I treatment. (B) The membrane association of PKCε in fractions, prepared as above from PKCεRE cells treated with BIM I, was determined by sedimentation of proteins at 100 000 g. The proteins remaining in the supernatant were recovered with TCA precipitation and equivalent samples of each fraction were subjected to western blot analysis.
Fig. 6. Plasma membrane-derived β1 integrin is present in the BIM I-induced dense compartment. (A) PKCεRE cells were treated for 90 min with BIM I (1 µM), or left untreated and then fractionated (see legend to Figure 5). The proteins in the fractions were recovered with TCA precipitation and subjected to western blot analysis following resolution by SDS–PAGE (8% polyacrylamide) and transfer to membrane. Upon BIM I treatment, β1 integrin was found to accumulate in a dense compartment (fractions 7–9), in a manner similar to PKCε (Figure 5). An equally dense β1 integrin-positive compartment apparently exists also under control conditions. Note that paxillin does not co-sediment with β1 integrin (or PKCε) even upon BIM I treatment. (B) PKCεRE cells were surface labelled with NHS-SS-biotin, allowed to recover at 37°C for 30 min, followed by a 90 min treatment with BIM I. Biotin was released from proteins remaining at the cell surface by MesNa treatment at 4°C, the cells were subjected to fractionation, and the vesicles were isolated as described above. The recovered vesicles were resuspended to a small volume of buffer followed, by refractionation on an equilibrium gradient. The proteins in the fractions were analysed by 6% SDS–PAGE under non-reducing conditions, followed by western blotting with peroxidase-conjugated avidin or anti-PKCε IgG (data not shown). The positions of the β1 integrin and the associated α-subunits are indicated.
Fig. 7. Cytosol-, energy- and PKC kinase activity-dependent reconstitution of PKCε release from vesicles. (A) Vesicles were isolated from BIM I-treated PKCεRE cells using fractionation. Fractions 7–9 from an equilibrium gradient were pooled, diluted in buffer and membrane-bound proteins were sedimented at 100 000 g. The recovered vesicles were resuspended to a small volume of buffer and incubated for 1 h at 37°C in reaction mixtures as indicated, followed by refractionation on the equilibrium gradient. The proteins in the fractions were recovered with TCA precipitation and subjected to western blot analysis following resolution by SDS–PAGE (10% polyacrylamide). (B) The membrane association of PKCε following the release reaction, in fractions prepared as above, was determined by sedimentation of membrane-associated proteins at 100 000 g. The proteins remaining in the supernatant were recovered with TCA precipitation and equivalent samples of each fraction were suspended in sample buffer and subjected to western blot analysis following resolution by SDS–PAGE (10% polyacrylamide).
Similar articles
- PKCepsilon-mediated phosphorylation of vimentin controls integrin recycling and motility.
Ivaska J, Vuoriluoto K, Huovinen T, Izawa I, Inagaki M, Parker PJ. Ivaska J, et al. EMBO J. 2005 Nov 16;24(22):3834-45. doi: 10.1038/sj.emboj.7600847. Epub 2005 Nov 3. EMBO J. 2005. PMID: 16270034 Free PMC article. - EHD1 regulates beta1 integrin endosomal transport: effects on focal adhesions, cell spreading and migration.
Jović M, Naslavsky N, Rapaport D, Horowitz M, Caplan S. Jović M, et al. J Cell Sci. 2007 Mar 1;120(Pt 5):802-14. doi: 10.1242/jcs.03383. Epub 2007 Feb 6. J Cell Sci. 2007. PMID: 17284518 - Ezrin is a downstream effector of trafficking PKC-integrin complexes involved in the control of cell motility.
Ng T, Parsons M, Hughes WE, Monypenny J, Zicha D, Gautreau A, Arpin M, Gschmeissner S, Verveer PJ, Bastiaens PI, Parker PJ. Ng T, et al. EMBO J. 2001 Jun 1;20(11):2723-41. doi: 10.1093/emboj/20.11.2723. EMBO J. 2001. PMID: 11387207 Free PMC article. - Identification of a novel interaction between integrin beta1 and 14-3-3beta.
Han DC, Rodriguez LG, Guan JL. Han DC, et al. Oncogene. 2001 Jan 18;20(3):346-57. doi: 10.1038/sj.onc.1204068. Oncogene. 2001. PMID: 11313964
Cited by
- PKCε Is Required for KRAS-Driven Lung Tumorigenesis.
Garg R, Cooke M, Benavides F, Abba MC, Cicchini M, Feldser DM, Kazanietz MG. Garg R, et al. Cancer Res. 2020 Dec 1;80(23):5166-5173. doi: 10.1158/0008-5472.CAN-20-1300. Epub 2020 Sep 29. Cancer Res. 2020. PMID: 32994205 Free PMC article. - Tyrosine Binding Protein Sites Regulate the Intracellular Trafficking and Processing of Amyloid Precursor Protein through a Novel Lysosome-Directed Pathway.
Tam JH, Cobb MR, Seah C, Pasternak SH. Tam JH, et al. PLoS One. 2016 Oct 24;11(10):e0161445. doi: 10.1371/journal.pone.0161445. eCollection 2016. PLoS One. 2016. PMID: 27776132 Free PMC article. - Protein kinase Cepsilon (PKCepsilon) and Src control PKCdelta activation loop phosphorylation in cardiomyocytes.
Rybin VO, Guo J, Gertsberg Z, Elouardighi H, Steinberg SF. Rybin VO, et al. J Biol Chem. 2007 Aug 10;282(32):23631-8. doi: 10.1074/jbc.M701676200. Epub 2007 Jun 14. J Biol Chem. 2007. PMID: 17569658 Free PMC article. - Localization of the PP2A B56gamma regulatory subunit at the Golgi complex: possible role in vesicle transport and migration.
Ito A, Koma Y, Sohda M, Watabe K, Nagano T, Misumi Y, Nojima H, Kitamura Y. Ito A, et al. Am J Pathol. 2003 Feb;162(2):479-89. doi: 10.1016/s0002-9440(10)63842-4. Am J Pathol. 2003. PMID: 12547706 Free PMC article. - Rab5c promotes AMAP1-PRKD2 complex formation to enhance β1 integrin recycling in EGF-induced cancer invasion.
Onodera Y, Nam JM, Hashimoto A, Norman JC, Shirato H, Hashimoto S, Sabe H. Onodera Y, et al. J Cell Biol. 2012 Jun 25;197(7):983-96. doi: 10.1083/jcb.201201065. J Cell Biol. 2012. PMID: 22734003 Free PMC article.
References
- Berditchevski F. (2001) Complexes of tetraspanins with integrins: more than meets the eye. J. Cell Sci., 114, 4143–4151. - PubMed
- Bretscher M.S. (1996) Moving membrane up to the front of migrating cells. Cell, 85, 465–467. - PubMed
Publication types
MeSH terms
Substances
LinkOut - more resources
Full Text Sources
Research Materials
