Essential role of PDK1 in regulating cell size and development in mice - PubMed (original) (raw)
Essential role of PDK1 in regulating cell size and development in mice
Margaret A Lawlor et al. EMBO J. 2002.
Abstract
PDK1 functions as a master kinase, phosphorylating and activating PKB/Akt, S6K and RSK. To learn more about the roles of PDK1, we generated mice that either lack PDK1 or possess PDK1 hypomorphic alleles, expressing only approximately 10% of the normal level of PDK1. PDK1(-/-) embryos die at embryonic day 9.5, displaying multiple abnormalities including lack of somites, forebrain and neural crest derived tissues; however, development of hind- and midbrain proceed relatively normally. In contrast, hypomorphic PDK1 mice are viable and fertile, and insulin injection induces the normal activation of PKB, S6K and RSK. Nevertheless, these mice are 40-50% smaller than control animals. The organ volumes from the PDK1 hypomorphic mice are reduced proportionately. We also establish that the volume of a number of PDK1-deficient cells is reduced by 35-60%, and show that PDK1 deficiency does not affect cell number, nuclear size or proliferation. We provide genetic evidence that PDK1 is essential for mouse embryonic development, and regulates cell size independently of cell number or proliferation, as well as insulin's ability to activate PKB, S6K and RSK.
Figures
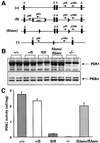
Fig. 1. Generation of hypomorphic PDK1 ES cells. (A) Diagram illustrating the 5′ end of the PDK1 gene and the different alleles that we have generated. The black boxes represent exons, continuous lines represent introns, triangles represent loxP sites and the neo box represents a neomycin resistance gene cassette. The positions of the PCR primers used to genotype the ES cells and mice are indicated with arrows. +, wild-type allelle; fl, allelle containing the neomycin resistance gene flanked with loxP sites between exons 2 and 3 as well as a loxP site in intron 4; flΔneo, allelle in which the neomycin resistance gene cassette was excised with the CRE recombinase but still possesses a loxP sites flanking exons 3 and 4; –, denotes the allele in which exon 3 and 4 have been removed with CRE and this also results in a frame-shift mutation (Williams et al., 2000), which would ablate expression of the PDK1 protein beyond exon 2, which includes the kinase and pleckstrin homology domain. (B) The indicated ES cell lines were grown to confluence, lysed and 20 µg of protein extract was electrophoresed on a 10% SDS–polyacrylamide gel and immunoblotted with antibodies that recognize murine PDK1 (top panel) or PKBα (bottom panel). Similar results were obtained in three separate experiments. (C) The ES cells were lysed, and PDK1 immunoprecipitated and assayed. Data are presented as the mean of two separate experiments ± SEM with each determination carried out in triplicate.
Fig. 2. PDK1 is ubiquitously expressed in early embryos. Whole-mount mRNA in situ hybridization for PDK1 expression was carried out on PDK1+/+ embryos at the indicated developmental stages. The embryos were processed in the presence (+) or absence (–) of PDK1 probe. Similar results were observed in two separate experiments.
Fig. 3. Analysis of PDK1–/– and PDK1+/+ embryos. (A–E) PDK1–/– and PDK1+/+ embryos were dissected in PBS and imaged on a Leica M275 microscope and whole-mount photographs were taken. hd, head; hf, headfolds; he, heart; al, allantois; eme, extra-embryonic membranes; psm, presomitic mesoderm; exr, extra-embryonic region; emr, embryonic region; nt, neural tube; so, somites. (F) A representative image of E7.5 PDK1+/+ and PDK1–/– embryonic endoderm cells stained with the lipid dye DilC16(3) using a Zeiss LSM410 microscope. (G) The size of the E7.5 PDK1+/+ and PDK1–/– embryonic endoderm cells was quantitated as described in Materials and methods. Two embryos of each genotype were analysed, with 120 cells in each embryo being measured (P < 0.0004).
Fig. 4. Scanning electron microscope images of E8.5 PDK1+/+ and E9.5 PDK1–/– embryos. Embryos were dissected into PBS and prepared for the scanning electron microscope as described in Materials and methods. (A and C–E) Dorsal views of E9.5 PDK1–/– embryos; (F) and (H) are dorsal and ventral view of a E9.5 PDK1+/+ embryos, respectively. (G) A ventral view of a mutant embryo, whereas (B) is a dorsal view of an E8.5 PDK1+/+ embryo. hd, head; hf, head folds; al, allantois; nt, neural tube; oph, open portion of the hindbrain; pos, pre-otic sulcus; psm, presomitic mesoderm; rp, Rathke’s pouch; op, otic pit; so, somites; ba, branchial arches; fb, forebrain; *, no somites; #, no dorsal root ganglia; §, no heart.
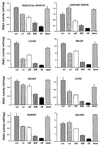
Fig. 5. Reduced PDK1 activity in PDK1fl/fl and PDK1–/fl mice. Tissue extracts from the indicated mice were prepared. PDK1 was immunoprecipitated and assayed. Data are presented as the mean ± SEM and is representative of three separate experiments with each determination carried out in triplicate. Δneo, flΔneo/flΔneo.
Fig. 6. Activation of PKB, S6K1 and RSK is normal in PDK1–/fl mice. (A) Mice were fasted overnight and injected with either saline (–) or increasing doses of insulin namely (0.0625, 0.625, 12.5 or 250 mU/g of mouse) for 10 min and the indicated tissues harvested as described in Materials and methods. Lysates were immunoblotted with antibodies that recognize PKBα phosphorylated at Thr308 (top panel, P-T308) and Ser473 (middle panel, P-S473) or the PKBα protein (bottom panel, Total PKB). (B) As above, except that the mice were injected with saline or insulin (12.5 mU/g of mouse) for 20 min. S6K1 was immunoprecipitated and assayed. (C) As in (B) except that cell lysates from skeletal muscle were either immunoblotted with antibodies recognizing phosphorylated ERK1/ERK2 (P-ERK1) or the ERK1/ERK2 proteins (Total ERK1), as well as RSK1 and RSK2 isoforms. It should be noted that the levels of ERK2 in skeletal muscle appear to be lower than we can detect. RSK isoforms were also immunoprecipitated and assayed. For the immunoblotting data shown, results were obtained in two separate experiments. For the S6K and RSK enzymic assays, the data are presented as the mean ± SEM of two separate experiments with each determination carried out in triplicate.
Fig. 6. Activation of PKB, S6K1 and RSK is normal in PDK1–/fl mice. (A) Mice were fasted overnight and injected with either saline (–) or increasing doses of insulin namely (0.0625, 0.625, 12.5 or 250 mU/g of mouse) for 10 min and the indicated tissues harvested as described in Materials and methods. Lysates were immunoblotted with antibodies that recognize PKBα phosphorylated at Thr308 (top panel, P-T308) and Ser473 (middle panel, P-S473) or the PKBα protein (bottom panel, Total PKB). (B) As above, except that the mice were injected with saline or insulin (12.5 mU/g of mouse) for 20 min. S6K1 was immunoprecipitated and assayed. (C) As in (B) except that cell lysates from skeletal muscle were either immunoblotted with antibodies recognizing phosphorylated ERK1/ERK2 (P-ERK1) or the ERK1/ERK2 proteins (Total ERK1), as well as RSK1 and RSK2 isoforms. It should be noted that the levels of ERK2 in skeletal muscle appear to be lower than we can detect. RSK isoforms were also immunoprecipitated and assayed. For the immunoblotting data shown, results were obtained in two separate experiments. For the S6K and RSK enzymic assays, the data are presented as the mean ± SEM of two separate experiments with each determination carried out in triplicate.
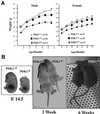
Fig. 7. Reduced size of PDK1fl/fl and PDK1–/fl mice. (A) The mean body weight of male and female PDK1+/+, PDK1+/fl and PDK1fl/fl mice at the indicated age. Values represent the mean ± SEM for each data point. The numbers (n) of each genotype are indicated on the graph. (B) A representative photograph of PDK1–/fl and PDK1+/fl littermates at E14.5, 1 week and 6 weeks of age is shown. (C) As in (A) for the indicated mice genotypes. (D) The organ volume of kidney, pancreas, spleen and adrenal gland of PDK1+/fl and PDK1–/fl littermates was measured using the Cavalieri method as described in Materials and methods. The data are presented as the mean ± SEM of three different mice per genotype, and only error bars larger than the size of the symbols are shown.
Fig. 7. Reduced size of PDK1fl/fl and PDK1–/fl mice. (A) The mean body weight of male and female PDK1+/+, PDK1+/fl and PDK1fl/fl mice at the indicated age. Values represent the mean ± SEM for each data point. The numbers (n) of each genotype are indicated on the graph. (B) A representative photograph of PDK1–/fl and PDK1+/fl littermates at E14.5, 1 week and 6 weeks of age is shown. (C) As in (A) for the indicated mice genotypes. (D) The organ volume of kidney, pancreas, spleen and adrenal gland of PDK1+/fl and PDK1–/fl littermates was measured using the Cavalieri method as described in Materials and methods. The data are presented as the mean ± SEM of three different mice per genotype, and only error bars larger than the size of the symbols are shown.
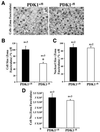
Fig. 8. PDK1–/fl mice possess smaller adrenal cells. (A) The top panel shows a micrograph (magnification ×250) of zona fasciculata cells of the adrenal gland from PDK1–/fl (right) and PDK1+/fl (left) mice. The panels are representative of the micrographs taken. (B) The cell size was measured using the disector principle as described in Materials and methods. The data are presented as the mean ± SEM from three separate experiments as a percentage of the PDK1+/fl cell size. The asterisk denotes that size of PDK1–/fl cells is significantly (P < 0.005) lower than that of PDK1+/fl cells. (C) The size of the nuclei was also measured using the disector principle. The data are presented as the mean ± SEM from two separate experiments as a percentage of the PDK1+/fl nuclear size. (D) The number of cells present in the zona fasciculata was determined by dividing the total volume of zona fasciculata cells by the volume of an individual cell. The data are presented as the mean ± SEM from three separate experiments.
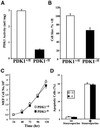
Fig. 9. PDK1–/fl MEF cells are smaller than PDK1+/fl cells but proliferate at the same rate. (A) PDK1 was immunoprecipitated from PDK1+/fl and PDK1–/fl cell lysates from primary MEF cells and assayed. The assays were performed in triplicate and are presented as the mean ± SEM from two separate experiments. (B) The size of PDK1+/fl and PDK1–/fl MEF cells was measured by the Cavalieri method as described in Materials and methods. Thirty-six PDK1+/fl and 32 PDK1–/fl cells were analysed. (C) Proliferation of the PDK1+/fl and PDK1–/fl MEF cells was measured as described in Materials and methods. The data are presented as the mean ± SEM from four separate experiments. (D) Apoptosis of the PDK1+/fl and PDK1–/fl MEF cells was measured by a TUNEL assay using the fluorescent in situ cell death detection method. Cells were grown to 50% confluency and then treated in the presence (+) or absence (–) of 5 µM staurosporine to induce apoptosis. The fluorescent cell death detection assay was performed in accordance with the manufacturer’s instructions and 150 cells were analysed for each condition. Similar results were obtained in two experiments.
Similar articles
- In vivo role of the phosphate groove of PDK1 defined by knockin mutation.
Collins BJ, Deak M, Murray-Tait V, Storey KG, Alessi DR. Collins BJ, et al. J Cell Sci. 2005 Nov 1;118(Pt 21):5023-34. doi: 10.1242/jcs.02617. Epub 2005 Oct 11. J Cell Sci. 2005. PMID: 16219676 - The in vivo role of PtdIns(3,4,5)P3 binding to PDK1 PH domain defined by knockin mutation.
McManus EJ, Collins BJ, Ashby PR, Prescott AR, Murray-Tait V, Armit LJ, Arthur JS, Alessi DR. McManus EJ, et al. EMBO J. 2004 May 19;23(10):2071-82. doi: 10.1038/sj.emboj.7600218. Epub 2004 Apr 29. EMBO J. 2004. PMID: 15116068 Free PMC article. - The role of 3-phosphoinositide-dependent protein kinase 1 in activating AGC kinases defined in embryonic stem cells.
Williams MR, Arthur JS, Balendran A, van der Kaay J, Poli V, Cohen P, Alessi DR. Williams MR, et al. Curr Biol. 2000 Apr 20;10(8):439-48. doi: 10.1016/s0960-9822(00)00441-3. Curr Biol. 2000. PMID: 10801415 - Dissecting the role of the 3-phosphoinositide-dependent protein kinase-1 (PDK1) signalling pathways.
Bayascas JR. Bayascas JR. Cell Cycle. 2008 Oct;7(19):2978-82. doi: 10.4161/cc.7.19.6810. Epub 2008 Oct 18. Cell Cycle. 2008. PMID: 18802401 Review. - PDK1: the major transducer of PI 3-kinase actions.
Bayascas JR. Bayascas JR. Curr Top Microbiol Immunol. 2010;346:9-29. doi: 10.1007/82_2010_43. Curr Top Microbiol Immunol. 2010. PMID: 20563709 Review.
Cited by
- The kinase PDK1 is essential for B-cell receptor mediated survival signaling.
Park SG, Long M, Kang JA, Kim WS, Lee CR, Im SH, Strickland I, Schulze-Luehrmann J, Hayden MS, Ghosh S. Park SG, et al. PLoS One. 2013;8(2):e55378. doi: 10.1371/journal.pone.0055378. Epub 2013 Feb 5. PLoS One. 2013. PMID: 23393571 Free PMC article. - Perspectives in PDK1 evolution: insights from photosynthetic and non-photosynthetic organisms.
Dittrich AC, Devarenne TP. Dittrich AC, et al. Plant Signal Behav. 2012 Jun;7(6):642-9. doi: 10.4161/psb.20038. Epub 2012 May 14. Plant Signal Behav. 2012. PMID: 22580698 Free PMC article. Review. - Phosphatase and tensin homologue (PTEN) regulates synaptic plasticity independently of its effect on neuronal morphology and migration.
Sperow M, Berry RB, Bayazitov IT, Zhu G, Baker SJ, Zakharenko SS. Sperow M, et al. J Physiol. 2012 Feb 15;590(4):777-92. doi: 10.1113/jphysiol.2011.220236. Epub 2011 Dec 6. J Physiol. 2012. PMID: 22147265 Free PMC article. - Critical role for Rsk2 in T-lymphocyte activation.
Lin JX, Spolski R, Leonard WJ. Lin JX, et al. Blood. 2008 Jan 15;111(2):525-33. doi: 10.1182/blood-2007-02-072207. Epub 2007 Oct 15. Blood. 2008. PMID: 17938253 Free PMC article. - The 3-Phosphoinositide-Dependent Protein Kinase 1 Inhibits Rod Photoreceptor Development.
Xing T, Hass DT, Zhang SS, Barnstable CJ. Xing T, et al. Front Cell Dev Biol. 2018 Oct 10;6:134. doi: 10.3389/fcell.2018.00134. eCollection 2018. Front Cell Dev Biol. 2018. PMID: 30364083 Free PMC article.
References
- Alessi D.R. (2001) Discovery of PDK1, one of the missing links in insulin signal transduction. Biochem. Soc. Trans, 29, 1–14. - PubMed
- Avruch J., Belham,C., Weng,Q., Hara,K. and Yonezawa,K. (2001) The p70 S6 kinase integrates nutrient and growth signals to control translational capacity. Prog. Mol. Subcell. Biol., 26, 115–154. - PubMed
- Bohni R., Riesgo-Escovar,J., Oldham,S., Brogiolo,W., Stocker,H., Andruss,B.F., Beckingham,K. and Hafen,E. (1999) Autonomous control of cell and organ size by CHICO, a Drosophila homolog of vertebrate IRS1-4. Cell, 97, 865–875. - PubMed
- Brazil D.P. and Hemmings,B.A. (2001) Ten years of protein kinase B signalling: a hard Akt to follow. Trends Biochem. Sci., 26, 657–664. - PubMed
Publication types
MeSH terms
Substances
LinkOut - more resources
Full Text Sources
Other Literature Sources
Molecular Biology Databases
Miscellaneous
