Powerful regression-based quantitative-trait linkage analysis of general pedigrees - PubMed (original) (raw)
Powerful regression-based quantitative-trait linkage analysis of general pedigrees
Pak C Sham et al. Am J Hum Genet. 2002 Aug.
Abstract
We present a new method of quantitative-trait linkage analysis that combines the simplicity and robustness of regression-based methods and the generality and greater power of variance-components models. The new method is based on a regression of estimated identity-by-descent (IBD) sharing between relative pairs on the squared sums and squared differences of trait values of the relative pairs. The method is applicable to pedigrees of arbitrary structure and to pedigrees selected on the basis of trait value, provided that population parameters of the trait distribution can be correctly specified. Ambiguous IBD sharing (due to incomplete marker information) can be accommodated in the method by appropriate specification of the variance-covariance matrix of IBD sharing between relative pairs. We have implemented this regression-based method and have performed simulation studies to assess, under a range of conditions, estimation accuracy, type I error rate, and power. For normally distributed traits and in large samples, the method is found to give the correct type I error rate and an unbiased estimate of the proportion of trait variance accounted for by the additive effects of the locus-although, in cases where asymptotic theory is doubtful, significance levels should be checked by simulations. In large sibships, the new method is slightly more powerful than variance-components models. The proposed method provides a practical and powerful tool for the linkage analysis of quantitative traits.
Figures
Figure 1
Theoretical sibship NCP over squared QTL variance
_Q_2
, obtained from equation (2) for the regression method and from appendix D for the VC method, under the assumption of a sibling correlation of 0.25.
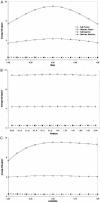
Figure 2
Effect of model misspecification. Each point represents the average
χ2
statistic obtained from 2,000 simulated replicates, containing 250 sib quads. The QTL and residual polygenic variances are 0.2 and 0.3, respectively. In each case, the true trait model has mean 0, variance 1, and heritability 0.5. The misspecified mean, variance, and covariance are shown on the _X_-axes of panels a, b, and c, respectively. “Perfect marker” represents complete IBD information; “imperfect marker” represents a diallelic marker with equally frequent alleles.
Figure 3
Structure for simulated cousin pedigree
Comment in
- Regression-based quantitative-trait-locus mapping in the 21st century.
Feingold E. Feingold E. Am J Hum Genet. 2002 Aug;71(2):217-22. doi: 10.1086/341964. Am J Hum Genet. 2002. PMID: 12154779 Free PMC article. No abstract available.
Similar articles
- Multipoint quantitative-trait linkage analysis in general pedigrees.
Almasy L, Blangero J. Almasy L, et al. Am J Hum Genet. 1998 May;62(5):1198-211. doi: 10.1086/301844. Am J Hum Genet. 1998. PMID: 9545414 Free PMC article. - Composite statistics for QTL mapping with moderately discordant sibling pairs.
Forrest WF, Feingold E. Forrest WF, et al. Am J Hum Genet. 2000 May;66(5):1642-60. doi: 10.1086/302897. Epub 2000 Apr 7. Am J Hum Genet. 2000. PMID: 10762549 Free PMC article. - Equivalence between Haseman-Elston and variance-components linkage analyses for sib pairs.
Sham PC, Purcell S. Sham PC, et al. Am J Hum Genet. 2001 Jun;68(6):1527-32. doi: 10.1086/320593. Epub 2001 May 14. Am J Hum Genet. 2001. PMID: 11353401 Free PMC article. - Genetic linkage methods for quantitative traits.
Amos CI, de Andrade M. Amos CI, et al. Stat Methods Med Res. 2001 Feb;10(1):3-25. doi: 10.1177/096228020101000102. Stat Methods Med Res. 2001. PMID: 11329691 Review. - [Two approaches of quantitative-trait linkage analysis].
Su SY, Gu DF. Su SY, et al. Yi Chuan. 2004 Mar;26(2):253-6. Yi Chuan. 2004. PMID: 15662739 Review. Chinese.
Cited by
- Genome-wide association analyses of North American Rheumatoid Arthritis Consortium and Framingham Heart Study data utilizing genome-wide linkage results.
Yoo YJ, Pinnaduwage D, Waggott D, Bull SB, Sun L. Yoo YJ, et al. BMC Proc. 2009 Dec 15;3 Suppl 7(Suppl 7):S103. doi: 10.1186/1753-6561-3-s7-s103. BMC Proc. 2009. PMID: 20017967 Free PMC article. - Linkage scan for quantitative traits identifies new regions of interest for substance dependence in the Collaborative Study on the Genetics of Alcoholism (COGA) sample.
Agrawal A, Hinrichs AL, Dunn G, Bertelsen S, Dick DM, Saccone SF, Saccone NL, Grucza RA, Wang JC, Cloninger CR, Edenberg HJ, Foroud T, Hesselbrock V, Kramer J, Bucholz KK, Kuperman S, Nurnberger JI Jr, Porjesz B, Schuckit MA, Goate AM, Bierut LJ. Agrawal A, et al. Drug Alcohol Depend. 2008 Jan 11;93(1-2):12-20. doi: 10.1016/j.drugalcdep.2007.08.015. Epub 2007 Oct 17. Drug Alcohol Depend. 2008. PMID: 17942244 Free PMC article. - Mapping loci influencing blood pressure in the Framingham pedigrees using model-free LOD score analysis of a quantitative trait.
Knight J, North BV, Sham PC, Curtis D. Knight J, et al. BMC Genet. 2003 Dec 31;4 Suppl 1(Suppl 1):S74. doi: 10.1186/1471-2156-4-S1-S74. BMC Genet. 2003. PMID: 14975142 Free PMC article. - Rank transformation in Haseman-Elston regression using scores for location-scale alternatives.
Gerhard D, Hothorn LA. Gerhard D, et al. Hum Hered. 2010;69(3):143-51. doi: 10.1159/000267994. Epub 2009 Dec 18. Hum Hered. 2010. PMID: 20029226 Free PMC article. - Linkage analysis of alcohol dependence symptoms in the community.
Hansell NK, Agrawal A, Whitfield JB, Morley KI, Gordon SD, Lind PA, Pergadia ML, Montgomery GW, Madden PA, Todd RD, Heath AC, Martin NG. Hansell NK, et al. Alcohol Clin Exp Res. 2010 Jan;34(1):158-63. doi: 10.1111/j.1530-0277.2009.01077.x. Epub 2009 Oct 23. Alcohol Clin Exp Res. 2010. PMID: 19860796 Free PMC article.
References
Electronic-Database Information
- Genetic Power Calculator, http://statgen.iop.kcl.ac.uk/gpc/
References
- Abecasis GR, Cherny SS, Cookson WO, Cardon LR (2002) Merlin—rapid analysis of dense genetic maps using sparse gene flow trees. Nat Genet 30:97–101 - PubMed
- Blackwelder WC, Elston RC (1985) A comparison of sib-pair linkage tests for disease susceptibility loci. Genet Epidemiol 2:85–97 - PubMed
Publication types
MeSH terms
LinkOut - more resources
Full Text Sources
Other Literature Sources


