A postsynaptic transient K(+) current modulated by arachidonic acid regulates synaptic integration and threshold for LTP induction in hippocampal pyramidal cells - PubMed (original) (raw)
A postsynaptic transient K(+) current modulated by arachidonic acid regulates synaptic integration and threshold for LTP induction in hippocampal pyramidal cells
Geert M J Ramakers et al. Proc Natl Acad Sci U S A. 2002.
Abstract
Voltage-gated ion channels in the dendrites and somata of central neurons can modulate the impact of synaptic inputs. One of the ionic currents contributing to such modulation is the fast inactivating A-type potassium current (I(A)). We have investigated the role of I(A) in synaptic integration in rat CA1 pyramidal cells by using arachidonic acid (AA) and heteropodatoxin-3 (HpTX3), a selective blocker of the Kv4 channels underlying much of the somatodendritic I(A). AA and HpTX3 each reduced I(A) by 60-70% (measured at the soma) and strongly enhanced the amplitude and summation of excitatory postsynaptic responses, thus facilitating action potential discharges. HpTX3 also reduced the threshold for induction of long-term potentiation. We conclude that the postsynaptic I(A) is activated during synaptic depolarizations and effectively regulates the somatodendritic integration of high-frequency trains of synaptic input. AA, which can be released by such input, enhances synaptic efficacy by suppressing I(A), which could play an important role in frequency-dependent synaptic plasticity in the hippocampus.
Figures
Figure 1
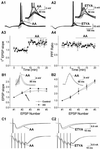
AA and ETYA increase synaptic responses in CA1 pyramidal cells. (A) Typical examples of the effect of 10 μM AA (A1) and 5 μM ETYA (A2) on a train of EPSPs evoked by synaptic stimuli (five stimuli at 100 Hz). The EPSP train failed to elicit action potentials in control conditions, but was increased beyond the spike threshold during the application of AA and ETYA (curved arrow; see also the enlarged traces in Right Inset). Time course of the effect of AA on the slope of the first EPSP (A3; n = 4). Application of 10 μM AA caused an increase in the slope of the first EPSP, which stabilized after 2.5 min. The normalized PPF ratio (A4; EPSP2/EPSP1) was calculated from the same experiments. Application of 10 μM AA resulted in a slight, nonsignificant decrease in the PPF ratio. (B) The effect of AA on the EPSP slope (normalized to the first) during a train of five stimuli at 100 Hz, recorded with 140 mM K-gluconate (B1, n = 4). In control conditions (open circles; before AA application) the EPSP slope increased to 158% at the third EPSP and then leveled off (161% at the fifth EPSP). In the presence of AA (filled circles) the EPSPs were enhanced (to 186% at the third EPSP). With an intracellular medium containing 140 mM Cs-gluconate (B2, n = 4), the summation of the EPSPs was linear from the first to the fifth EPSP in control conditions (open circles) and AA had no significant effect on the EPSP summation (filled circles). Typical examples of the effect of AA on a train of EPSPs (average of 10 traces) are shown as Insets. (C) The top traces are typical examples of the effect of 10 μM AA (C1) and 5 μM ETYA (C2) on a single EPSC (the average of 10 traces), demonstrating that AA and ETYA caused an increase in the EPSC amplitude. The lower traces are typical examples of the effect of 10 μM AA and 5 μM ETYA on EPSCs (average of 10 traces) evoked by a train of synaptic stimuli (five stimuli at 100 Hz). During AA and ETYA the EPSCs increased, most pronounced for the first, second, and third EPSCs.
Figure 2
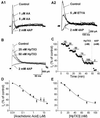
AA, ETYA, and HpTX3 reduce _I_A in CA1 pyramidal cells. (A) AA (A1; 1 and 5 μM) reduced the amplitude of _I_A, which was subsequently fully blocked by 2 mM 4AP. The effect of 5 μM nonmetabolizable AA analogue ETYA and 2 mM 4AP on _I_A is shown in A2. (B) Typical example of the effect of two different concentrations of HpTX3 on I A recorded in the soma of CA1 cells. Increasing concentrations (25 and 50 nM) of HpTX3 reduced the amplitude of _I_A. Subsequent application of 2 mM 4AP blocked _I_A completely. (C) The effect of cumulatively increasing doses of HpTX3 on the _I_A amplitude. Five different concentrations of HpTX3 (10, 25, 50, 75, and 100 nM) were tested (n = 5). The maximal effect was obtained between 75 and 100 nM HpTX3, and subsequent application of 2 mM 4AP blocked _I_A completely. (D) Average dose–response curve (n = 4–6) showing that the EC50 for AA was 0.27 μM and that the maximal inhibition of _I_A was 68%. (E) Average dose–response curve (n = 4) for the effect of HpTX3 on _I_A. The EC50 was 34.95 nM, and the maximal inhibition of _I_A was 65.4%.
Figure 3
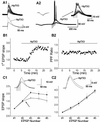
HpTX3 increases synaptic responses in CA1 pyramidal cells. (A) Bath application of 100 nM HpTX3 increased single EPSPs (A1). (Upper) Individual traces (n = 10); (Lower) averaged traces. A typical example of the effect of HpTX3 on a train of EPSPs in response to synaptic stimuli (five stimuli at 100 Hz) is shown in A2. The EPSPs did not reach threshold for action potential firing in control medium, but were strongly enhanced and triggered action potentials after addition of HpTX3 (curved arrow; see also the enlarged traces in Right Inset). Left Inset shows that no significant change was induced by HpTX3 in the response to a hyperpolarizing current (100 pA, 50 ms). (B) Time course of the effect of HpTX3 on the slope of the first EPSP (B1; n = 5), normalized to the slope during the control period. The slope was increased by application of 100 nM HpTX3. The normalized PPF ratio (EPSP2/EPSP1) was calculated from the same experiments as shown in B1, and application of 100 nM HpTX3 did not change this ratio (B2). (C) The effect of HpTX3 on the slopes of all five EPSPs (normalized to the slope of the first EPSP) in response to a train of five stimuli at 100 Hz, recorded with 140 mM K-gluconate (C1; n = 5). In control medium, before HpTX3 application, the EPSP slope increased to 171% at the third EPSP and then declined to 153% at the fifth EPSP. HpTX3 enhanced the increase in the EPSPs, so that the third EPSP slope increased to 208%. However, the relative decline after the third EPSP remained. Typical examples of EPSPs in response to a train of stimuli (five stimuli at 100 Hz) in control conditions and in the presence of 100 nM HpTX3 recorded in whole-cell mode with an internal solution containing 140 mM K-gluconate (K+) are shown as Insets. HpTX3 increased the slope of the first EPSP and the amplitude of the fifth EPSP in the train. Recordings with an intracellular medium with 140 mM Cs-gluconate are shown in C2 (n = 4). The summation of the EPSPs (as determined by the EPSP slope) was linear from the second to the fifth EPSP, no decline occurred after the third EPSP, and HpTX3 had no significant effect on the EPSP summation (unlike in C1). Typical examples EPSPs (five stimuli at 100 Hz) in control conditions and in the presence of 100 nM HpTX3 recorded in whole-cell mode with an internal solution containing 140 mM Cs-gluconate are shown as insets. On average HpTX3 did not enhance the EPSPs.
Figure 4
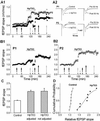
HpTX3 reduces the threshold for LTP induction. (A) Individual experiment in which fEPSPs were elicited in the CA1 field by stimulating two independent pathways (P1 and P2) in stratum radiatum_._ (A1) After a 30-min stable baseline period, a weak tetanus (100 stimuli at 50 Hz test intensity) was applied to one of the pathways, P1 (black arrow 1). This train did not induce any stable potentiation. A second weak tetanus given to P1 (black arrow 2) also failed to change the fEPSP slope. Application of 100 nM HpTX3 (horizontal line) increased the fEPSP slope. After the HpTX3 effect had stabilized, a weak tetanus was delivered to P2 (gray arrow 3), inducing a stable potentiation of the fEPSP slope. Next, the intensity of P1 was reduced to evoke responses of comparable size to before the HpTX3 application (dashed downward arrow 4), and another weak tetanus given to P1 (black arrow 5) that produced stable potentiation. After termination of the HpTX3 application, the fEPSP slopes were not detectably reduced. A strong tetanus (100 Hz for 1 s) given to P1 (long black arrow 6) or P2 (long white arrow 6) did not induce any further potentiation. Sample traces (averages of five sweeps) from this experiment are plotted in A2. The profiles on the left illustrate the effect of HpTX3 on the fEPSPs, and the profiles on the right illustrate the effect of the 50-Hz train at adjusted intensity (P1) or test intensity (P2) in the presence of HpTX3. (B) B1 shows the average of four independent experiments for one pathway (P1), in which the stimulus intensity was reduced after HpTX3 had increased synaptic responses (dashed arrow). B2 shows the average of four independent experiments for the other pathway (P2), in which the stimulus intensity was not changed after HpTX3 had increased synaptic responses. (C) Bar graph showing the effect of a weak tetanus (50 Hz for 2 s) measured after 20–30 min. In control conditions (n = 4) the fEPSP slope was not changed by the weak tetanus, whereas in the presence of 100 nM HpTX3 the weak tetanus produced an increase in the fEPSP slope. The increase was the same for the pathway that received the train at test intensity (P1, n = 4) and the pathway that received the train at reduced intensity (P2, n = 4). The effect of the 50-Hz train in the presence of HpTX3 was significantly different from the effect of the 50-Hz train in control conditions (P ≤ 0.05 for both intensities, Student's t test). (D) Cumulative probability plot of the effect of a weak tetanus (50 Hz for 2 s) on the fEPSP slope in control conditions (n = 8, open circles) and in the presence of 100 nM HpTX3 (n = 8, filled circles, data of test and reduced intensity were pooled). In the presence of HpTX3, the 50-Hz train produced a potentiation of the fEPSP slope in all experiments, thus shifting the curve to the right.
Similar articles
- Heterosynaptic metaplastic regulation of synaptic efficacy in CA1 pyramidal neurons of rat hippocampus.
Le Ray D, Fernández De Sevilla D, Belén Porto A, Fuenzalida M, Buño W. Le Ray D, et al. Hippocampus. 2004;14(8):1011-25. doi: 10.1002/hipo.20021. Hippocampus. 2004. PMID: 15390171 - SK (KCa2) channels do not control somatic excitability in CA1 pyramidal neurons but can be activated by dendritic excitatory synapses and regulate their impact.
Gu N, Hu H, Vervaeke K, Storm JF. Gu N, et al. J Neurophysiol. 2008 Nov;100(5):2589-604. doi: 10.1152/jn.90433.2008. Epub 2008 Aug 6. J Neurophysiol. 2008. PMID: 18684909 - Input- and subunit-specific AMPA receptor trafficking underlying long-term potentiation at hippocampal CA3 synapses.
Kakegawa W, Tsuzuki K, Yoshida Y, Kameyama K, Ozawa S. Kakegawa W, et al. Eur J Neurosci. 2004 Jul;20(1):101-10. doi: 10.1111/j.1460-9568.2004.03461.x. Eur J Neurosci. 2004. PMID: 15245483 - Active dendrites, potassium channels and synaptic plasticity.
Johnston D, Christie BR, Frick A, Gray R, Hoffman DA, Schexnayder LK, Watanabe S, Yuan LL. Johnston D, et al. Philos Trans R Soc Lond B Biol Sci. 2003 Apr 29;358(1432):667-74. doi: 10.1098/rstb.2002.1248. Philos Trans R Soc Lond B Biol Sci. 2003. PMID: 12740112 Free PMC article. Review.
Cited by
- SK2 channel modulation contributes to compartment-specific dendritic plasticity in cerebellar Purkinje cells.
Ohtsuki G, Piochon C, Adelman JP, Hansel C. Ohtsuki G, et al. Neuron. 2012 Jul 12;75(1):108-20. doi: 10.1016/j.neuron.2012.05.025. Neuron. 2012. PMID: 22794265 Free PMC article. - The Emerging Concept of Intrinsic Plasticity: Activity-dependent Modulation of Intrinsic Excitability in Cerebellar Purkinje Cells and Motor Learning.
Shim HG, Lee YS, Kim SJ. Shim HG, et al. Exp Neurobiol. 2018 Jun;27(3):139-154. doi: 10.5607/en.2018.27.3.139. Epub 2018 Jun 30. Exp Neurobiol. 2018. PMID: 30022866 Free PMC article. Review. - Synapse formation is enhanced by oral administration of uridine and DHA, the circulating precursors of brain phosphatides.
Wurtman RJ, Cansev M, Ulus IH. Wurtman RJ, et al. J Nutr Health Aging. 2009 Mar;13(3):189-97. doi: 10.1007/s12603-009-0056-3. J Nutr Health Aging. 2009. PMID: 19262950 Review. - Kv4 accessory protein DPPX (DPP6) is a critical regulator of membrane excitability in hippocampal CA1 pyramidal neurons.
Kim J, Nadal MS, Clemens AM, Baron M, Jung SC, Misumi Y, Rudy B, Hoffman DA. Kim J, et al. J Neurophysiol. 2008 Oct;100(4):1835-47. doi: 10.1152/jn.90261.2008. Epub 2008 Jul 30. J Neurophysiol. 2008. PMID: 18667548 Free PMC article. - DPP6 Localization in Brain Supports Function as a Kv4 Channel Associated Protein.
Clark BD, Kwon E, Maffie J, Jeong HY, Nadal M, Strop P, Rudy B. Clark BD, et al. Front Mol Neurosci. 2008 Oct 23;1:8. doi: 10.3389/neuro.02.008.2008. eCollection 2008. Front Mol Neurosci. 2008. PMID: 18978958 Free PMC article.
References
- Meves H. Prog Neurobiol. 1994;43:175–186. - PubMed
- Lynch M A, Errington M L, Bliss T V. Neuroscience. 1989;30:693–701. - PubMed
- Massicotte G, Oliver M W, Lynch G, Baudry M. Brain Res. 1990;537:49–53. - PubMed
- Drapeau C, Pellerin L, Wolfe L S, Avoli M. Neurosci Lett. 1990;115:286–292. - PubMed
- Williams J H, Errington M L, Lynch M A, Bliss T V. Nature (London) 1989;341:739–742. - PubMed
Publication types
MeSH terms
Substances
LinkOut - more resources
Full Text Sources
Miscellaneous


