Akt maintains cell size and survival by increasing mTOR-dependent nutrient uptake - PubMed (original) (raw)
Akt maintains cell size and survival by increasing mTOR-dependent nutrient uptake
Aimee L Edinger et al. Mol Biol Cell. 2002 Jul.
Abstract
In multicellular organisms, constituent cells depend on extracellular signals for growth, proliferation, and survival. When cells are withdrawn from growth factors, they undergo apoptosis. Expression of constitutively active forms of the serine/threonine kinase Akt/PKB can prevent apoptosis upon growth factor withdrawal. Akt-mediated survival depends in part on the maintenance of glucose metabolism, suggesting that reduced glucose utilization contributes to growth factor withdrawal-induced death. However, it is unclear how restricting access to extracellular glucose alone would lead to the metabolic collapse observed after growth factor withdrawal. We report herein that growth factor withdrawal results in the loss of surface transporters for not only glucose but also amino acids, low-density lipoprotein, and iron. This coordinated decline in transporters and receptors for extracellular molecules creates a catabolic state characterized by atrophy and a decline in the mitochondrial membrane potential. Activated forms of Akt maintained these transporters on the cell surface in the absence of growth factor through an mTOR-dependent mechanism. The mTOR inhibitor rapamycin diminished Akt-mediated increases in cell size, mitochondrial membrane potential, and cell survival. These results suggest that growth factors control cellular growth and survival by regulating cellular access to extracellular nutrients in part by modulating the activity of Akt and mTOR.
Figures
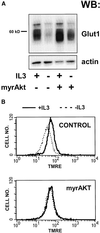
Figure 1
Activated Akt can partially prevent the decrease in Glut1 protein levels and mitochondrial membrane potential observed upon IL3 withdrawal. (A) Control FL5.12 cells expressing Bcl-xL alone or cells also expressing myrAkt were maintained in or withdrawn from IL3 for 24 h, lysed, and equivalent amounts of total protein were examined by Western blot for Glut1 and actin protein levels. (B) Cells were prepared as in A but were stained with the potentiometric dye TMRE to evaluate the mitochondrial membrane potential. Dissipation of the mitochondrial proton gradient with CCCP resulted in background levels of fluorescence (our unpublished data).
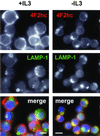
Figure 2
4F2hc is down-regulated and trafficked to lysosomes upon growth factor withdrawal. Bcl-xL–expressing FL5.12 cells were maintained in the presence or absence of IL3 for 24 h and processed for immunofluorescence. In the overlay, 4F2hc staining is shown in red, LAMP-1 staining in green, and 4,6-diamidino-2-phenylindole staining of nuclear DNA in blue. The white bar represents 10 μM.
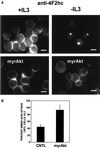
Figure 3
MyrAkt maintains surface levels of 4F2hc and amino acid transport in the absence of IL3. (A) Control FL5.12 cells expressing Bcl-xL or cells also expressing myrAkt were evaluated for 4F2hc staining after 24 h in the presence or absence of IL3. The white bar represents 10 μM. (B) Control FL5.12 cells expressing Bcl-xL (CNTL) or cells also expressing myrAkt were withdrawn from IL3 for 24 h and evaluated for their ability to take up a mixture of 15 tritiated amino acids as described in MATERIALS AND METHODS. Values are normalized to the uptake in control cells with IL3. The results of four independent experiments are shown, error bars reflect SEM.
Figure 4
LDL receptor expression decreases with IL3 withdrawal but is maintained by myrAkt. Control Bcl-xL–expressing cells or cells also expressing myrAkt were maintained in the presence or absence of IL3 for 24 h. Cells were incubated with DiI-labeled human LDL for 1 h on ice, washed, fixed in paraformaldehyde, and examined by fluorescence microscopy. Three independent experiments were performed.
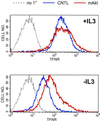
Figure 5
Transferrin receptor surface expression is regulated by IL3 and Akt. Control Bcl-xL-expressing cells (CNTL) or cells also expressing myrAkt were maintained in the presence or absence of IL3 for 24 h and analyzed by FACS for transferrin receptor (TFNR) surface expression. As a negative control, Bcl-xL cells were stained with secondary only (no 1°). The same negative control plot is shown in both panels. Three independent experiments were performed.
Figure 6
Akt E40K maintains surface expression of 4F2hc in the absence of IL3. FL5.12 cells expressing the EF6 vector or cells expressing Akt E40K were evaluated for 4F2hc staining after 14 h in the presence or absence of IL3. The white bar represents 10 μM.
Figure 7
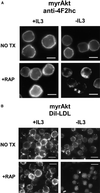
Effects of myrAkt on 4F2hc, LDL receptor, and transferrin receptor surface expression are suppressed by rapamycin. (A) MyrAkt-expressing cells were treated with 20 nM rapamycin (RAP) and maintained in the presence or absence of IL3 for 24 h before fixation and staining for 4F2hc. The white bar represents 10 μM. (B) MyrAkt expressing cells were prepared as in A but incubated with DiI-LDL on ice for 1 h before fixation. The white bar represents 10 μM. (C) Control cells (CNTL) expressing Bcl-xL or cells also expressing myrAkt were withdrawn from IL3 for 24 h in the presence or absence of 20 nM rapamycin (rap) as indicated and evaluated by FACS for surface expression of the transferrin receptor. The same negative control plot is shown in both panels.
Figure 8
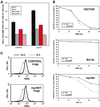
Rapamycin interferes with the positive effects of myrAkt on cell size, survival, and mitochondrial membrane potential. (A) Control Bcl-xL–expressing cells or cells also expressing myrAkt were maintained in the presence or absence of IL3 and 20 nM rapamycin as indicated for 24 h, stained with PI and Hoechst 33342, and evaluated by FACS sorting. Cell size analysis was restricted to PI-negative cells with a 2N DNA content. Cell volume measured in arbitrary units of forward angle light scatter is presented. One of three similar experiments is shown, error bars represent the SD of triplicate samples. (B) Vector control FL5.12 cells or cells expressing Bcl-xL or myrAkt were maintained in the presence or absence of IL3 and 20 nM rapamycin (rap) as indicated and their viability measured by PI exclusion at the indicated time points. One of three similar experiments is shown; error bars reflect the SD of triplicate samples. (C) Control Bcl-xL–expressing cells or cells also expressing myrAkt were treated with 20 nm rapamycin (rap) and maintained in the presence or absence of IL3 for 24 h and stained with TMRE to evaluate the mitochondrial membrane potential. Treatment with CCCP reduced fluorescence to background levels (our unpublished data).
Similar articles
- Rab7 prevents growth factor-independent survival by inhibiting cell-autonomous nutrient transporter expression.
Edinger AL, Cinalli RM, Thompson CB. Edinger AL, et al. Dev Cell. 2003 Oct;5(4):571-82. doi: 10.1016/s1534-5807(03)00291-0. Dev Cell. 2003. PMID: 14536059 - Akt and Bcl-xL promote growth factor-independent survival through distinct effects on mitochondrial physiology.
Plas DR, Talapatra S, Edinger AL, Rathmell JC, Thompson CB. Plas DR, et al. J Biol Chem. 2001 Apr 13;276(15):12041-8. doi: 10.1074/jbc.M010551200. Epub 2001 Jan 12. J Biol Chem. 2001. PMID: 11278698 - Akt up-regulation increases resistance to microtubule-directed chemotherapeutic agents through mammalian target of rapamycin.
VanderWeele DJ, Zhou R, Rudin CM. VanderWeele DJ, et al. Mol Cancer Ther. 2004 Dec;3(12):1605-13. Mol Cancer Ther. 2004. PMID: 15634654 - Activation of the mammalian target of rapamycin pathway acutely inhibits insulin signaling to Akt and glucose transport in 3T3-L1 and human adipocytes.
Tremblay F, Gagnon A, Veilleux A, Sorisky A, Marette A. Tremblay F, et al. Endocrinology. 2005 Mar;146(3):1328-37. doi: 10.1210/en.2004-0777. Epub 2004 Dec 2. Endocrinology. 2005. PMID: 15576463 - Multiple signaling pathways promote B lymphocyte stimulator dependent B-cell growth and survival.
Woodland RT, Fox CJ, Schmidt MR, Hammerman PS, Opferman JT, Korsmeyer SJ, Hilbert DM, Thompson CB. Woodland RT, et al. Blood. 2008 Jan 15;111(2):750-60. doi: 10.1182/blood-2007-03-077222. Epub 2007 Oct 17. Blood. 2008. PMID: 17942753 Free PMC article.
Cited by
- Metabolic reprogramming in renal cancer: Events of a metabolic disease.
Chakraborty S, Balan M, Sabarwal A, Choueiri TK, Pal S. Chakraborty S, et al. Biochim Biophys Acta Rev Cancer. 2021 Aug;1876(1):188559. doi: 10.1016/j.bbcan.2021.188559. Epub 2021 May 6. Biochim Biophys Acta Rev Cancer. 2021. PMID: 33965513 Free PMC article. Review. - Signal transduction in cancer.
Sever R, Brugge JS. Sever R, et al. Cold Spring Harb Perspect Med. 2015 Apr 1;5(4):a006098. doi: 10.1101/cshperspect.a006098. Cold Spring Harb Perspect Med. 2015. PMID: 25833940 Free PMC article. Review. - Niacin protects against UVB radiation-induced apoptosis in cultured human skin keratinocytes.
Lin F, Xu W, Guan C, Zhou M, Hong W, Fu L, Liu D, Xu A. Lin F, et al. Int J Mol Med. 2012 Apr;29(4):593-600. doi: 10.3892/ijmm.2012.886. Epub 2012 Jan 12. Int J Mol Med. 2012. PMID: 22246168 Free PMC article. - A Phase I Trial of Sirolimus with "7&3" Induction Chemotherapy in Patients with Newly Diagnosed Acute Myeloid Leukemia.
Palmisiano N, Jeschke G, Wilde L, Alpdogan O, Carabasi M, Filicko-O'Hara J, Grosso D, Klumpp T, Martinez U, Wagner J, Carroll MP, Perl A, Kasner M. Palmisiano N, et al. Cancers (Basel). 2023 Oct 25;15(21):5129. doi: 10.3390/cancers15215129. Cancers (Basel). 2023. PMID: 37958304 Free PMC article. - p53 regulation of the IGF-1/AKT/mTOR pathways and the endosomal compartment.
Feng Z. Feng Z. Cold Spring Harb Perspect Biol. 2010 Feb;2(2):a001057. doi: 10.1101/cshperspect.a001057. Cold Spring Harb Perspect Biol. 2010. PMID: 20182617 Free PMC article. Review.
References
- Aisen P, Enns C, Wessling-Resnick M. Chemistry and biology of eukaryotic iron metabolism. Int J Biochem Cell Biol. 2001;33:940–959. - PubMed
- Bental M, Deutsch C. Metabolic changes in activated T cells: an NMR study of human peripheral blood lymphocytes. Magn Reson Med. 1993;29:317–326. - PubMed
Publication types
MeSH terms
Substances
LinkOut - more resources
Full Text Sources
Other Literature Sources
Miscellaneous
