Dynamic trafficking and delivery of connexons to the plasma membrane and accretion to gap junctions in living cells - PubMed (original) (raw)
Dynamic trafficking and delivery of connexons to the plasma membrane and accretion to gap junctions in living cells
Undine Lauf et al. Proc Natl Acad Sci U S A. 2002.
Abstract
Certain membrane channels including acetylcholine receptors, gap junction (GJ) channels, and aquaporins arrange into large clusters in the plasma membrane (PM). However, how these channels are recruited to the clusters is unknown. To address this question, we have investigated delivery of GJ channel subunits (connexons) assembled from green fluorescent protein (GFP)-tagged connexin 43 (Cx43) to the PM and GJs in living cells. Fluorescence-photobleaching of distinct areas of Cx43-GFP GJs demonstrated that newly synthesized channels were accrued to the outer margins of channel clusters. Time-lapse microscopy further revealed that connexons were delivered in vesicular carriers traveling along microtubules from the Golgi to the PM. Routing and insertion of connexons occurred predominantly into the nonjunctional PM. These PM connexons can move laterally as shown by photo-bleaching and thus, can reach the margins of channel clusters. There, the apposing PMs are close enough to allow connexons to dock into complete GJ channels. When connexon delivery to the PM was inhibited by brefeldin A, or nocodazole pretreatment, the PM pool initially enabled connexon accrual to the clusters but further accrual was inhibited upon depletion. Taken together, our results indicate that GJ channel clusters grow by accretion at their outer margins from connexon subunits that were delivered to the nonjunctional PM, and explain how connexons in the PM can function in intra-/extracellular signaling before GJ channel formation and direct cell-cell communication.
Figures
Fig 1.
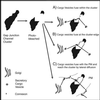
Schematic representation of possible mechanisms by which clusters of GJ channels can be assembled (A_–_C), and of the FRAP method that was used to investigate this process in living cells.
Fig 2.
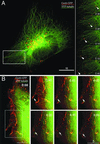
Accrual of newly synthesized connexons to the outer margins of GJ channel clusters tracked in living cells. Fluorescence of selected areas (boxed) of GJs assembled from Cx43-GFP in transfected HeLa cells was permanently photo-bleached and recruitment of newly synthesized channels (denoted by arrows), shown in plane view in A and in edge view in B, was observed over time. Accrual of channels to the cluster in cells treated with BFA (C) or nocodazole (D). Disruption of the Golgi (labeled with arrowheads) and MTs was verified in treated cells before photo-bleaching (first two panels in C and D). (E) Amount of channels added to the plaque margins in A_–_D was determined by measuring total fluorescence intensity (in arbitrary units) along a line traversing one of the outer plaque margins in the last postbleach images. (F) The size of GJs was measured during the postbleach period by outlining bleached and recovered areas and unbleached plaques in the vicinity (n = 6) by polygons, and pixel-size of the polygons (in percent) was plotted over time. Bars in all figures are given in μm.
Fig 3.
Vesicular constitutive transport carriers deliver connexons from the Golgi to the PM. HeLa cells transfected with Cx43-GFP were imaged in the early phase of GJ assembly by rapid time-lapse microscopy. Many vesicular (A) and occasionally tubular transport containers (see Fig. 6, which is published as supporting information on the PNAS web site) exited the Golgi (G) and were transported in all directions, predominantly distant from GJs (GJ) and cell–cell appositions (CCA), into the periphery of the cells (see Movie 1). (B) Trails (depicted with arrows) and directional movement of secretory vesicles was visualized by color coding and merging the images of the time-lapse recording. (C) The track of a single vesicle traveling 11 μm in 31 s from time point (TP) 29–50. Preceding fusion, the vesicle becomes tethered (marked with an arrowhead) and only moves locally, restrained from TP 50–60. (D) Velocity plot of vesicle movement. The instantaneous speed of six vesicles moving saltatory along tracks was measured and plotted in distance traveled per second. Black and white was inverted in the images and Movie 1.
Fig 4.
Constitutive Cx43 containing transport carriers move along MTs and deliver connexons into the nonjunctional PM. (A) In HeLa cells transfected with Cx43-CFP (red) and YFP-tubulin (green), vesicular constitutive carriers and larger degradative structures associated closely with, and moved along MTs (see Movie 2, which is published as supporting information on the PNAS web site). Trails of Cx43-CFP vesicles moving overall away from the Golgi are evident. A slower migrating Cx43-GFP carrier (marked with arrowhead) traveling up to 0.58 μm/s away from the Golgi into the cell periphery is tracked. (B) Vesicular constitutive Cx43-CFP-containing carriers traveling along a MT that extends to the PM was imaged in 15-s intervals. Vesicles gathered at the end before, one after the other, fused with the nonjunctional PM (depicted with an arrow; see Movie 3, which is published as supporting information on the PNAS web site).
Fig 5.
Qualitative FRAP and FLIP experiments indicate that connexons delivered into the nonjunctional PM move freely. Confocal sections focused on the PM of HeLa cells expressing Cx43-GFP are shown. Besides a homogenous fluorescence indicative of dispersed connexons in the PM, larger bright fluorescent spots representing intracellular vesicular structures and possibly Cx43-GFP aggregates are visible. (A) After photo-bleaching of square areas, unbleached connexons diffuse into the bleached areas, whereas bright fluorescent spots remain largely immobile. (B) Mobile and immobile PM fluorescence fractions were calculated from cells in which intracellular fluorescence was prebleached. (C) Loss of PM fluorescence (FLIP) was calculated by photo-bleaching a selected square area repeatedly within 20 min, and fluorescence intensity of the cell outside the bleached area was measured over time. Experiments were quantified and fluorescence intensity (in arbitrary units in A) or normalized fluorescence intensities (as a ratio in B and C) were plotted over time.
Similar articles
- Connexin 43 connexon to gap junction transition is regulated by zonula occludens-1.
Rhett JM, Jourdan J, Gourdie RG. Rhett JM, et al. Mol Biol Cell. 2011 May;22(9):1516-28. doi: 10.1091/mbc.E10-06-0548. Epub 2011 Mar 16. Mol Biol Cell. 2011. PMID: 21411628 Free PMC article. - Cx43 has distinct mobility within plasma-membrane domains, indicative of progressive formation of gap-junction plaques.
Simek J, Churko J, Shao Q, Laird DW. Simek J, et al. J Cell Sci. 2009 Feb 15;122(Pt 4):554-62. doi: 10.1242/jcs.036970. Epub 2009 Jan 27. J Cell Sci. 2009. PMID: 19174466 - Mechanisms of Cx43 and Cx26 transport to the plasma membrane and gap junction regeneration.
Thomas T, Jordan K, Simek J, Shao Q, Jedeszko C, Walton P, Laird DW. Thomas T, et al. J Cell Sci. 2005 Oct 1;118(Pt 19):4451-62. doi: 10.1242/jcs.02569. Epub 2005 Sep 13. J Cell Sci. 2005. PMID: 16159960 - Structure of cardiac gap junction intercellular channels.
Yeager M. Yeager M. J Struct Biol. 1998;121(2):231-45. doi: 10.1006/jsbi.1998.3972. J Struct Biol. 1998. PMID: 9615440 Review. - Lighting up gap junction channels in a flash.
Evans WH, Martin PE. Evans WH, et al. Bioessays. 2002 Oct;24(10):876-80. doi: 10.1002/bies.10159. Bioessays. 2002. PMID: 12325119 Review.
Cited by
- Gap junctions.
Nielsen MS, Axelsen LN, Sorgen PL, Verma V, Delmar M, Holstein-Rathlou NH. Nielsen MS, et al. Compr Physiol. 2012 Jul;2(3):1981-2035. doi: 10.1002/cphy.c110051. Compr Physiol. 2012. PMID: 23723031 Free PMC article. Review. - LRP6 acts as a scaffold protein in cardiac gap junction assembly.
Li J, Li C, Liang D, Lv F, Yuan T, The E, Ma X, Wu Y, Zhen L, Xie D, Wang S, Liu Y, Huang J, Shi J, Liu Y, Shi D, Xu L, Lin L, Peng L, Cui J, Zhu W, Chen YH. Li J, et al. Nat Commun. 2016 Jun 2;7:11775. doi: 10.1038/ncomms11775. Nat Commun. 2016. PMID: 27250245 Free PMC article. - Connexins in the Heart: Regulation, Function and Involvement in Cardiac Disease.
Rodríguez-Sinovas A, Sánchez JA, Valls-Lacalle L, Consegal M, Ferreira-González I. Rodríguez-Sinovas A, et al. Int J Mol Sci. 2021 Apr 23;22(9):4413. doi: 10.3390/ijms22094413. Int J Mol Sci. 2021. PMID: 33922534 Free PMC article. Review. - Expression and function of connexin 43 in human gingival wound healing and fibroblasts.
Tarzemany R, Jiang G, Larjava H, Häkkinen L. Tarzemany R, et al. PLoS One. 2015 Jan 13;10(1):e0115524. doi: 10.1371/journal.pone.0115524. eCollection 2015. PLoS One. 2015. PMID: 25584940 Free PMC article. - Cx43 associates with Na(v)1.5 in the cardiomyocyte perinexus.
Rhett JM, Ongstad EL, Jourdan J, Gourdie RG. Rhett JM, et al. J Membr Biol. 2012 Jul;245(7):411-22. doi: 10.1007/s00232-012-9465-z. Epub 2012 Jul 19. J Membr Biol. 2012. PMID: 22811280 Free PMC article.
References
- Gilula N. B., Reeves, O. R. & Steinbach, A. (1972) Nature (London) 235, 262-265. - PubMed
- Unger V. M., Kumar, N. M., Gilula, N. B. & Yeager, M. (1999) Science 283, 1176-1180. - PubMed
Publication types
MeSH terms
Substances
LinkOut - more resources
Full Text Sources
Other Literature Sources
Molecular Biology Databases
Miscellaneous


