ATP binding to the motor domain from an ABC transporter drives formation of a nucleotide sandwich dimer - PubMed (original) (raw)
ATP binding to the motor domain from an ABC transporter drives formation of a nucleotide sandwich dimer
Paul C Smith et al. Mol Cell. 2002 Jul.
Abstract
It has been proposed that the reaction cycle of ATP binding cassette (ABC) transporters is driven by dimerization of their ABC motor domains upon binding ATP at their mutual interface. However, no such ATP sandwich complex has been observed for an ABC from an ABC transporter. In this paper, we report the crystal structure of a stable dimer formed by the E171Q mutant of the MJ0796 ABC, which is hydrolytically inactive due to mutation of the catalytic base. The structure shows a symmetrical dimer in which two ATP molecules are each sandwiched between the Walker A motif in one subunit and the LSGGQ signature motif in the other subunit. These results establish the stereochemical basis of the power stroke of ABC transporter pumps.
Figures
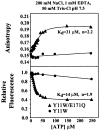
Figure 1. Na-ATP-Dependent Dimerization of the E171Q Mutant of MJ0796
Tryptophan fluorescence anisotropy titrations were conducted at 24°C on the Y11W mutant of MJ0796 either with or without the hydrolytically deficient E171Q mutation. The protein was used at a 1 μM concentration. Relative total fluorescence values are shown in the bottom panel, while fluorescence anisotropy values from the same titrations are shown in the top panel. The variables “Kd” and “n” refer to the dissociation constant and the cooperativity, respectively, and were determined by nonlinear curve fitting (solid lines).
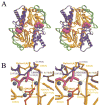
Figure 2. Crystal Structure of the MJ0796-E171Q ATP Sandwich Dimer
The stereo ribbon diagrams (Kraulis, 1991; Merritt and Bacon, 1997) are color coded according to subdomain organization, with the F1-type ATP binding core shown in orange, the antiparallel β subdomain in green, the α-helical subdomain in blue, and the γ-phosphate linker in red. This color scheme is equivalent to that used by Yuan et al. (2001), except for the presentation of the γ-phosphate linker in red. See Figure 3B for the location of the subdomains in the primary structure of the protein. (A) Overall dimer structure. The bound Na-ATP molecules are shown in space-filling representations, with the nucleotides shown in magenta and the cation cofactors shown in yellow. Sidechains contacting either the nucleotides or the other subunit are shown in ball-and-stick representations, color-coded according to the subdomain of origin; see Figure 3A for a detailed contact diagram including the identity of all of these residues. As shown here, the proximal face of the ABC contacts the TM domains in the crystal structure of MsbA (Chang and Roth, 2001). (B) Active site stereochemistry. Lighter shades are used to indicate segments coming from the “A” subunit whose Walker A motif is interacting with the nucleotide, while darker shades are used to indicate segments coming from the “B” subunit whose LSGGQ signature motif is interacting with the nucleotide. The dotted lines indicate H bonds and are colored to correspond to the donor group participating in the interaction. The yellow sphere indicates the Na+ cofactor of the nucleotide. The turquoise spheres indicate water molecules, with the rightmost one being the putative hydrolytic water.
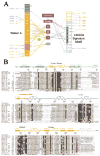
Figure 3. Nucleotide Contacts and Intersubunit Contacts in the MJ0796-E171Q Dimer
(A) Contact diagram. The residues are color-coded according to subdomain of origin as in Figure 2A, with plain text or italics used to indicate residues from the subunit whose Walker A motif or LSGGQ signature motif, respectively, is interacting with the nucleotide. The putative hydrolytic water is shown in cyan. The outermost columns show the protein-protein contacts (CCP4, 1994) across the dimer interface. Van der Waals contacts (≤3.6 Å) are represented by thin black lines, while H bonds (≤3.3 Å) are represented by thick lines colored to correspond with the subdomain or molecule containing the donor atom. Only the strongest (i.e., shortest) van der Waals contact between any two groups is shown (so the number of contacts shown in this panel does not match the total number cited in the text). The contacts to the Na+ atom are represented by thick yellow lines, and the aromatic stacking interaction between Tyr11 and the adenine base is represented by the very thick dashed line. Although Gln171 acts as an H bond donor to the putative hydrolytic water, the glutamate at this position in the wild-type protein will be one of three competing acceptor groups within H bonding distance. The molecular contacts are nearly identical at the two active sites in the dimer. (B) Sequence/structural alignment showing the residues making intersubunit contacts. The “Contacts” line above the sequence alignment indicates whether residues contact the nucleotide (n), the other protein subunit (p), or both (b), with plain text or italics used to indicate residues from the subunit whose Walker A motif or LSGGQ signature motif, respectively, is interacting with the nucleotide. The secondary structural elements in MJ0796 are color-coded according to subdomain of origin, with arrows, sinusoidal lines, and saw-toothed lines used to represent β strands, α helices, and 310-helices, respectively. The classification (Wilmot and Thornton, 1990) of well-defined β turns is indicated below the structural schematic, and the label “blg” indicates the positions of structurally conserved β bulges in the antiparallel β subdomain.
Figure 4. Conformational Differences between ADP-Bound and ATP-Bound MJ0796 Monomers
The crystal structure of Mg-ADP-bound wild-type MJ0796 (Yuan et al., 2001) (lighter colors) is superimposed on that of the Na-ATP-bound E171Q mutant (darker colors) based on least-squares alignment of 65 Cα atoms located in the α helix following the Walker A motif and the 6 β strands in the F1-type ATP binding core. The backbone and sidechains of each model are color coded according to subdomain organization as in Figure 2A. The crystal structure of the E171Q mutant of MJ0796 bound to Mg-ADP is essentially identical to that of the wild-type protein bound to the same ligand (data not shown). This view shows the molecular surface of the monomer facing the intersubunit interface in the nucleotide sandwich dimer.
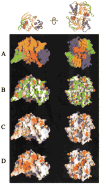
Figure 5. Surface Properties of the MJ0796-E171Q ATP-Bound Monomer and Dimer
The molecular surface (Nicholls, 1992) of the monomer facing the intersubunit interface is shown on the left, while the molecular surface of the dimer facing the transmembrane domains is shown on the right. The Na-ATP was not included in the molecular surface calculations in (A)–(C), where it is shown in ball-and-stick representation colored as in Figure 2A. For reference, ribbon diagrams of the protein molecules are shown in equivalent orientations at the top. (A) Color-coding according to subdomain organization with colors as in Figure 2A. (B) Color-coding according to chemical polarity, with acidic functional groups colored red, basic functional groups (including the atoms other than Cβ and Cγ in histidine side-chains) colored blue, uncharged polar atoms colored white, and carbon atoms not in charged functional groups colored green. (C and D) Color-coding according to electrostatic potential (Nicholls, 1992), assuming an ionic strength of 100 mM. Red and blue are used to represent negative and positive potentials, respectively, with fully saturated colors indicating a potential of magnitude ≥8 kT. The nucleotide was included in the calculation of both the molecular surface and the electrostatic potential in (D).
Figure 6. The ATP-Driven Reaction Cycle of ABC Transporters
The orange subdomain in the mechanistic schematic represents the antiparallel β subdomain combined with the F1-type ATP binding core, while the blue subdomain represents the γ-phosphate linker combined with the α-helical subdomain. The nucleotide is shown in magenta, with each circle representing one of its phosphate groups. The black trace in the free energy schematic represents the energy derived from the protein-nucleotide interactions, while the gray trace represents the energy of nucleotide hydrolysis. See text for additional information.
Similar articles
- Nucleotide binding to the homodimeric MJ0796 protein: a computational study of a prokaryotic ABC transporter NBD dimer.
Campbell JD, Sansom MS. Campbell JD, et al. FEBS Lett. 2005 Aug 1;579(19):4193-9. doi: 10.1016/j.febslet.2005.06.027. FEBS Lett. 2005. PMID: 16038903 - Crystal structures of the MJ1267 ATP binding cassette reveal an induced-fit effect at the ATPase active site of an ABC transporter.
Karpowich N, Martsinkevich O, Millen L, Yuan YR, Dai PL, MacVey K, Thomas PJ, Hunt JF. Karpowich N, et al. Structure. 2001 Jul 3;9(7):571-86. doi: 10.1016/s0969-2126(01)00617-7. Structure. 2001. PMID: 11470432 - Nucleotide-dependent allostery within the ABC transporter ATP-binding cassette: a computational study of the MJ0796 dimer.
Jones PM, George AM. Jones PM, et al. J Biol Chem. 2007 Aug 3;282(31):22793-803. doi: 10.1074/jbc.M700809200. Epub 2007 May 7. J Biol Chem. 2007. PMID: 17485460 - Nucleotide binding domain interactions during the mechanochemical reaction cycle of ATP-binding cassette transporters.
Moody JE, Thomas PJ. Moody JE, et al. J Bioenerg Biomembr. 2005 Dec;37(6):475-9. doi: 10.1007/s10863-005-9494-8. J Bioenerg Biomembr. 2005. PMID: 16691486 Review. - Structure of ABC transporters.
Zolnerciks JK, Andress EJ, Nicolaou M, Linton KJ. Zolnerciks JK, et al. Essays Biochem. 2011 Sep 7;50(1):43-61. doi: 10.1042/bse0500043. Essays Biochem. 2011. PMID: 21967051 Review.
Cited by
- Conformational changes relevant to channel activity and folding within the first nucleotide binding domain of the cystic fibrosis transmembrane conductance regulator.
Hudson RP, Chong PA, Protasevich II, Vernon R, Noy E, Bihler H, An JL, Kalid O, Sela-Culang I, Mense M, Senderowitz H, Brouillette CG, Forman-Kay JD. Hudson RP, et al. J Biol Chem. 2012 Aug 17;287(34):28480-94. doi: 10.1074/jbc.M112.371138. Epub 2012 Jun 21. J Biol Chem. 2012. PMID: 22722932 Free PMC article. - Impact of the Recent Mouse P-Glycoprotein Structure for Structure-Based Ligand Design.
Klepsch F, Ecker GF. Klepsch F, et al. Mol Inform. 2010 Apr 12;29(4):276-86. doi: 10.1002/minf.201000017. Epub 2010 Apr 20. Mol Inform. 2010. PMID: 27463054 Free PMC article. Review. - Protein structure-based gene expression signatures.
Rahman R, Zatorski N, Hansen J, Xiong Y, van Hasselt JGC, Sobie EA, Birtwistle MR, Azeloglu EU, Iyengar R, Schlessinger A. Rahman R, et al. Proc Natl Acad Sci U S A. 2021 May 11;118(19):e2014866118. doi: 10.1073/pnas.2014866118. Proc Natl Acad Sci U S A. 2021. PMID: 33941686 Free PMC article. - Multidrug Resistance in Mammals and Fungi-From MDR to PDR: A Rocky Road from Atomic Structures to Transport Mechanisms.
Khunweeraphong N, Kuchler K. Khunweeraphong N, et al. Int J Mol Sci. 2021 Apr 30;22(9):4806. doi: 10.3390/ijms22094806. Int J Mol Sci. 2021. PMID: 33946618 Free PMC article. Review. - Role of ATP binding and hydrolysis in assembly of MacAB-TolC macrolide transporter.
Lu S, Zgurskaya HI. Lu S, et al. Mol Microbiol. 2012 Dec;86(5):1132-43. doi: 10.1111/mmi.12046. Epub 2012 Oct 12. Mol Microbiol. 2012. PMID: 23057817 Free PMC article.
References
- Brunger AT. Free R value: a novel statistical quantity for assessing the accuracy of crystal structures. Nature. 1992a;355:472–475. - PubMed
- Brunger AT. X-PLOR Version 3.1: A System for Crystallography and NMR. New Haven, CT: Yale University Press; 1992b.
- Brunger AT, Adams PD, Clore GM, DeLano WL, Gros P, Grosse-Kunstleve RW, Jiang JS, Kuszewski J, Nilges M, Pannu NS, et al. Crystallography & NMR system: a new software suite for macromolecular structure determination. Acta Crystallogr D Biol Crystallogr. 1998;54:905–921. - PubMed
- Chang G, Roth CB. Structure of MsbA from E. coli: a homolog of the multidrug resistance ATP binding cassette (ABC) transporters. Science. 2001;293:1793–1800. - PubMed
- CCP4 (Collaborative Computational Project 4) The CCP4 suite: programs for protein crystallography. Acta Crystallogr D. 1994;50:760–763. - PubMed
Publication types
MeSH terms
Substances
LinkOut - more resources
Full Text Sources
Other Literature Sources
Molecular Biology Databases


