Chronic stress induces contrasting patterns of dendritic remodeling in hippocampal and amygdaloid neurons - PubMed (original) (raw)
Chronic stress induces contrasting patterns of dendritic remodeling in hippocampal and amygdaloid neurons
Ajai Vyas et al. J Neurosci. 2002.
Abstract
The hippocampus and the amygdala are essential components of the neural circuitry mediating stress responses. The hippocampus, which provides negative feedback regulation of the stress response, is particularly vulnerable to degenerative changes caused by chronic stress. Unlike the hippocampus, relatively little is known about how stress affects the amygdala and the nature of its role in the stress response. Hence, we examined the effects of two different models of chronic stress on hippocampal and amygdaloid neuronal morphology in rats. In agreement with previous reports, chronic immobilization stress (CIS) induced dendritic atrophy and debranching in CA3 pyramidal neurons of the hippocampus. In striking contrast, pyramidal and stellate neurons in the basolateral complex of the amygdala exhibited enhanced dendritic arborization in response to the same CIS. Chronic unpredictable stress (CUS), however, had little effect on CA3 pyramidal neurons and induced atrophy only in BLA bipolar neurons. These results indicate that chronic stress can cause contrasting patterns of dendritic remodeling in neurons of the amygdala and hippocampus. Moreover, CIS, but not CUS, reduced open-arm activity in the elevated plus-maze. These findings raise the possibility that certain forms of chronic stress, by affecting specific neuronal elements in the amygdala, may lead to behavioral manifestations of enhanced emotionality. Thus, stress-induced structural plasticity in amygdala neurons may provide a candidate cellular substrate for affective disorders triggered by chronic stress.
Figures
Fig. 1.
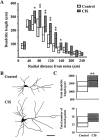
CIS is more effective compared with CUS in causing dendritic atrophy in hippocampal long-shaft CA3 pyramidal neurons.A, Effects of CIS on mean dendritic length (top) and number of branch points (bottom) for each successive 50 μm segment as a function of the radial distance of the corresponding segment from the soma (control cells, n = 50; CIS cells,n = 45). Changes in apical (left) and basal (right) dendrites are shown separately.B, Camera lucida drawings of representative Golgi-impregnated hippocampal CA3 pyramidal neurons from control and CIS-treated animals. Scale bar, 50 μm. C, Effects of CUS on mean dendritic length (top) and number of branch points (bottom) for each successive 50 μm segment as a function of the radial distance of the corresponding segment from the soma (control cells, n = 45; CUS cells,n = 50). Changes in apical (left) and basal (right) dendrites are shown separately. *p < 0.05, **p < 0.01; one-way ANOVA. Filled circle, black line: Control; open circle, gray line: CIS or CUS.
Fig. 2.
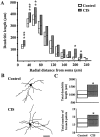
CIS increases dendritic arborization in BLA pyramidal neurons. A, Median values (horizontal line within each vertical bar) of total dendritic length for each successive 20 μm segment as a function of the radial distance of the corresponding segment from the soma (control cells, n = 18; CIS cells, n = 22). Inter-quartile ranges are represented by the lower (25th percentile) and upper (75th percentile) bounds of each vertical bar. B, Camera lucida drawings of representative Golgi-impregnated BLA pyramidal neurons from control and CIS-treated animals. Scale bar, 50 μm. C, Plots of median values and inter-quartile ranges for total dendritic length (top) and total number of branch points (bottom) for control (n = 18) and CIS (n = 22) neurons. *p < 0.05, **p < 0.01; randomized Mann–Whitney test.
Fig. 3.
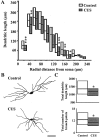
CIS increases dendritic arborization in BLA stellate neurons. A, Median values (horizontal line within each vertical bar) of total dendritic length for each successive 20 μm segment as a function of the radial distance of the corresponding segment from the soma (control cells, n = 43; CIS cells, n = 39). Inter-quartile ranges are represented by the lower (25th percentile) and upper (75th percentile) bounds of each vertical bar. B, Camera lucida drawings of representative Golgi-impregnated BLA stellate neurons from control and CIS-treated animals. Scale bar, 50 μm. C, Plots of median values and inter-quartile ranges for total dendritic length (top) and total number of branch points (bottom) for control (n = 43) and CIS (n = 39) neurons. *p < 0.05, **p < 0.01, ***p < 0.001; randomized Mann–Whitney test.
Fig. 4.
CUS causes dendritic atrophy in BLA bipolar/bitufted neurons. A, Median values (horizontal line within each vertical bar) of total dendritic length for each successive 20 μm segment as a function of the radial distance of the corresponding segment from the soma (control cells, n = 34; CUS cells, n = 39). Inter-quartile ranges are represented by the lower (25th percentile) and upper (75th percentile) bounds of each vertical bar. B, Camera lucida drawings of representative Golgi-impregnated BLA bipolar/bitufted neurons from control and CUS-treated animals. Scale bar, 50 μm.C, Plots of median values and inter-quartile ranges for total dendritic length (top) and total number of branch points (bottom) for control (n = 34) and CUS (n = 34) neurons. *p < 0.05, **p < 0.01, ***p < 0.001; randomized Mann–Whitney test.
Fig. 5.
Cumulative frequency plots summarizing the data for total dendritic length illustrating the contrasting effects of CIS (A) and CUS (B) on all BLA neurons. Pyramidal, left column; stellate, middle column; bipolar/bitufted, right column. The 50% mark (dashed line) for the total n in each plot represents the median value for the total dendritic length for the corresponding neuronal class. For clarity, the median values are marked with a solid vertical line (control:black; CIS or CUS: gray) in only those cases where there is a statistically significant difference relative to control. CIS induces a significant increase (right arrow) in total dendritic lengths of pyramidal and stellate neurons, without significant effect on bipolar/bitufted neurons. CUS causes a significant decrease (left arrow) in total dendritic length of bipolar/bitufted neurons, without affecting pyramidal and stellate neurons. Filled circle and_black line_: Control; open circle and_gray line_: CIS or CUS.
Similar articles
- Recovery after chronic stress fails to reverse amygdaloid neuronal hypertrophy and enhanced anxiety-like behavior.
Vyas A, Pillai AG, Chattarji S. Vyas A, et al. Neuroscience. 2004;128(4):667-73. doi: 10.1016/j.neuroscience.2004.07.013. Neuroscience. 2004. PMID: 15464275 - Effects of chronic stress on dendritic arborization in the central and extended amygdala.
Vyas A, Bernal S, Chattarji S. Vyas A, et al. Brain Res. 2003 Mar 7;965(1-2):290-4. doi: 10.1016/s0006-8993(02)04162-8. Brain Res. 2003. PMID: 12591150 - Repeated social stress leads to contrasting patterns of structural plasticity in the amygdala and hippocampus.
Patel D, Anilkumar S, Chattarji S, Buwalda B. Patel D, et al. Behav Brain Res. 2018 Jul 16;347:314-324. doi: 10.1016/j.bbr.2018.03.034. Epub 2018 Mar 23. Behav Brain Res. 2018. PMID: 29580891 - Plasticity of the hippocampus: adaptation to chronic stress and allostatic load.
McEwen BS. McEwen BS. Ann N Y Acad Sci. 2001 Mar;933:265-77. doi: 10.1111/j.1749-6632.2001.tb05830.x. Ann N Y Acad Sci. 2001. PMID: 12000027 Review. - Stress and hippocampal plasticity.
McEwen BS. McEwen BS. Annu Rev Neurosci. 1999;22:105-22. doi: 10.1146/annurev.neuro.22.1.105. Annu Rev Neurosci. 1999. PMID: 10202533 Review.
Cited by
- Stress Transiently Affects Pavlovian-to-Instrumental Transfer.
Morgado P, Silva M, Sousa N, Cerqueira JJ. Morgado P, et al. Front Neurosci. 2012 Jun 25;6:93. doi: 10.3389/fnins.2012.00093. eCollection 2012. Front Neurosci. 2012. PMID: 22737108 Free PMC article. - Changes in ribosomal protein S3 immunoreactivity and its protein levels in the gerbil hippocampus following subacute and chronic restraint stress.
Park JH, Lee CH, Yan BC, Ahn JH, Lee YJ, Park CW, Cho JH, Choi SY, Lee YL, Won MH, Lee HY. Park JH, et al. Neurochem Res. 2012 Jul;37(7):1428-35. doi: 10.1007/s11064-012-0727-z. Epub 2012 Mar 6. Neurochem Res. 2012. PMID: 22392256 - Social influences on neuroplasticity: stress and interventions to promote well-being.
Davidson RJ, McEwen BS. Davidson RJ, et al. Nat Neurosci. 2012 Apr 15;15(5):689-95. doi: 10.1038/nn.3093. Nat Neurosci. 2012. PMID: 22534579 Free PMC article. Review. - The association of PTSD symptom severity with amygdala nuclei volumes in traumatized youths.
Ousdal OT, Milde AM, Hafstad GS, Hodneland E, Dyb G, Craven AR, Melinder A, Endestad T, Hugdahl K. Ousdal OT, et al. Transl Psychiatry. 2020 Aug 17;10(1):288. doi: 10.1038/s41398-020-00974-4. Transl Psychiatry. 2020. PMID: 32807799 Free PMC article. - Serotonergic innervation of the amygdala: targets, receptors, and implications for stress and anxiety.
Asan E, Steinke M, Lesch KP. Asan E, et al. Histochem Cell Biol. 2013 Jun;139(6):785-813. doi: 10.1007/s00418-013-1081-1. Epub 2013 Mar 15. Histochem Cell Biol. 2013. PMID: 23494464 Review.
References
- Allen JP, Allen CF. Role of the amygdaloid complexes in the stress-induced release of ACTH in the rat. Neuroendocrinology. 1974;15:220–230. - PubMed
- Bremner JD, Randall P, Vermetten E, Staib L, Bronen RA, Mazure C, Capelli S, McCarthy G, Innis RB, Charney DS. Magnetic resonance imaging-based measurement of hippocampal volume in posttraumatic stress disorder related to childhood physical and sexual abuse: a preliminary report. Biol Psychiatry. 1997;41:23–32. - PMC - PubMed
- Chapman PF, Chattarji S. Synaptic plasticity in the amygdala. In: Aggleton JP, editor. The amygdala, Ed 2. Oxford UP; Oxford: 2000. pp. 154–177.
Publication types
MeSH terms
LinkOut - more resources
Full Text Sources
Other Literature Sources
Miscellaneous


