Y genetic data support the Neolithic demic diffusion model - PubMed (original) (raw)
Y genetic data support the Neolithic demic diffusion model
Lounes Chikhi et al. Proc Natl Acad Sci U S A. 2002.
Abstract
There still is no general agreement on the origins of the European gene pool, even though Europe has been more thoroughly investigated than any other continent. In particular, there is continuing controversy about the relative contributions of European Palaeolithic hunter-gatherers and of migrant Near Eastern Neolithic farmers, who brought agriculture to Europe. Here, we apply a statistical framework that we have developed to obtain direct estimates of the contribution of these two groups at the time they met. We analyze a large dataset of 22 binary markers from the non-recombining region of the Y chromosome (NRY), by using a genealogical likelihood-based approach. The results reveal a significantly larger genetic contribution from Neolithic farmers than did previous indirect approaches based on the distribution of haplotypes selected by using post hoc criteria. We detect a significant decrease in admixture across the entire range between the Near East and Western Europe. We also argue that local hunter-gatherers contributed less than 30% in the original settlements. This finding leads us to reject a predominantly cultural transmission of agriculture. Instead, we argue that the demic diffusion model introduced by Ammerman and Cavalli-Sforza [Ammerman, A. J. & Cavalli-Sforza, L. L. (1984) The Neolithic Transition and the Genetics of Populations in Europe (Princeton Univ. Press, Princeton)] captures the major features of this dramatic episode in European prehistory.
Figures
Fig 1.
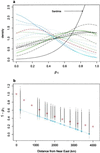
Palaeolithic and Neolithic contributions across Europe. (a) Posterior distributions of _p_1 for all European populations. The colors correspond to the following populations. Blue: Albania (solid), Macedonia (dashed), Calabria (dotted), Croatia (dot-dash), and Greece (long-dash). Green: Czech Republic (solid), Hungary (dashed), Poland (dotted), and Ukraine (dot-dash). Black: Holland (solid), Germany (dashed), France (dotted), North Italy (dot-dash), Catalunia (long-dash), Andalusia (two-dash), and Sardinia (solid, see arrow). Red: Georgia (solid). The Sardinian posterior distribution is markedly sharper. Archaeological evidence also suggests that it is unlikely to have experienced introgression from Near Eastern farmers. (b) Linear regression of _p_1 against geographic distance from the Near East. The geographic distance was calculated from the midpoint of Syria and Lebanon. The distribution of points was generated by sampling one _p_1 value from each of the posterior distributions in a and then by calculating the linear regression between this set of values and geographic distances. The fitted values are plotted for each of 1,000 replicates. As fitted values are plotted, they can occur outside the range (0–1). Note that some samples were at very similar geographic distances from Near East, so the distributions are overlaid. It is possible to fit the simple stepping-stone model described in the text to this distribution. For instance, the values shown by the red circles are the expected proportions for n = 10 admixture events in which the contribution of the farming community, P N was 0.85. There is a range of other combinations, which fit equally well. However, for large n values, the relationship becomes very curvilinear and requires large values of P N to explain the trend and average contribution of 50% (or 65% by using the Sardinian). The dotted blue line with the circles represents the regression obtained by Semino et al. (16) by using Eu4, -9, -10, and -11. It is significantly different from the regressions we obtain by using all of the allelic information (P < 0.001).
Fig 2.
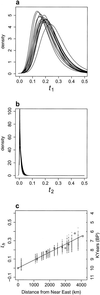
Distribution of the T/N _i_s for all populations. (a) Posterior distributions of T/N 1. The different curves represent the amount of scaled time (generations divided by population size) between the present-sample of Basques used and the ancestral population of hunter-gatherers who interbred with arriving farmers. Different T/_N_1 distributions are expected if the early European populations were highly differentiated from each other. This result is not what we observe. This outcome shows that the present-day samples of the Basques represent a non-biased sample of the original distribution and/or that the amount of differentiation between hunter-gatherer populations was not very high compared with drift since the admixture. The large and highly significant difference with b shows that the method is indeed sufficiently sensitive to detect different values of T/N i. (b) Posterior distributions of T/_N_2. Scaled times (as in a), but for the Near East populations. (c) Linear regression of T/N h against geographic distance. For each of the admixed population samples, one T/N h value was randomly sampled from the corresponding posterior distribution (not shown). A linear regression was then calculated between this set of values and the set of geographic distances from the Near East. Fitted values are plotted for each of 1,000 replicates. The calibrated radiocarbon dates represent the 95% limit for the earliest date of arrival of agriculture. These dates are based on locations for which there were more than 30 available data points (S. Shennan, personal communication).
Similar articles
- Female and male perspectives on the neolithic transition in Europe: clues from ancient and modern genetic data.
Rasteiro R, Chikhi L. Rasteiro R, et al. PLoS One. 2013 Apr 17;8(4):e60944. doi: 10.1371/journal.pone.0060944. Print 2013. PLoS One. 2013. PMID: 23613761 Free PMC article. - Genetic evidence for the spread of agriculture in Europe by demic diffusion.
Sokal RR, Oden NL, Wilson C. Sokal RR, et al. Nature. 1991 May 9;351(6322):143-5. doi: 10.1038/351143a0. Nature. 1991. PMID: 2030731 - [Mitochondria DNA markers and genetic demographic processes in neolithic Europe].
Maliarchuk BA. Maliarchuk BA. Genetika. 1998 Jul;34(7):1009-12. Genetika. 1998. PMID: 9749344 Russian. - Complete mitochondrial genomes reveal neolithic expansion into Europe.
Fu Q, Rudan P, Pääbo S, Krause J. Fu Q, et al. PLoS One. 2012;7(3):e32473. doi: 10.1371/journal.pone.0032473. Epub 2012 Mar 13. PLoS One. 2012. PMID: 22427842 Free PMC article. - Human genomic diversity in Europe: a summary of recent research and prospects for the future.
Cavalli-Sforza LL, Piazza A. Cavalli-Sforza LL, et al. Eur J Hum Genet. 1993;1(1):3-18. doi: 10.1159/000472383. Eur J Hum Genet. 1993. PMID: 7520820 Review.
Cited by
- Genome-wide scan with nearly 700,000 SNPs in two Sardinian sub-populations suggests some regions as candidate targets for positive selection.
Piras IS, De Montis A, Calò CM, Marini M, Atzori M, Corrias L, Sazzini M, Boattini A, Vona G, Contu L. Piras IS, et al. Eur J Hum Genet. 2012 Nov;20(11):1155-61. doi: 10.1038/ejhg.2012.65. Epub 2012 Apr 25. Eur J Hum Genet. 2012. PMID: 22535185 Free PMC article. - Signature of a pre-human population decline in the critically endangered Reunion Island endemic forest bird Coracina newtoni.
Salmona J, Salamolard M, Fouillot D, Ghestemme T, Larose J, Centon JF, Sousa V, Dawson DA, Thebaud C, Chikhi L. Salmona J, et al. PLoS One. 2012;7(8):e43524. doi: 10.1371/journal.pone.0043524. Epub 2012 Aug 20. PLoS One. 2012. PMID: 22916272 Free PMC article. - Tracing the origin and spread of agriculture in Europe.
Pinhasi R, Fort J, Ammerman AJ. Pinhasi R, et al. PLoS Biol. 2005 Dec;3(12):e410. doi: 10.1371/journal.pbio.0030410. Epub 2005 Nov 29. PLoS Biol. 2005. PMID: 16292981 Free PMC article. - Genomic history of the Sardinian population.
Chiang CWK, Marcus JH, Sidore C, Biddanda A, Al-Asadi H, Zoledziewska M, Pitzalis M, Busonero F, Maschio A, Pistis G, Steri M, Angius A, Lohmueller KE, Abecasis GR, Schlessinger D, Cucca F, Novembre J. Chiang CWK, et al. Nat Genet. 2018 Oct;50(10):1426-1434. doi: 10.1038/s41588-018-0215-8. Epub 2018 Sep 17. Nat Genet. 2018. PMID: 30224645 Free PMC article. - Contrasting maternal and paternal genetic histories among five ethnic groups from Khyber Pakhtunkhwa, Pakistan.
Tariq M, Ahmad H, Hemphill BE, Farooq U, Schurr TG. Tariq M, et al. Sci Rep. 2022 Jan 19;12(1):1027. doi: 10.1038/s41598-022-05076-3. Sci Rep. 2022. PMID: 35046511 Free PMC article.
References
- Ammerman A. J. & Cavalli-Sforza, L. L., (1984) The Neolithic Transition and the Genetics of Populations in Europe (Princeton Univ. Press, Princeton).
- Bellwood P. (2001) Annu. Rev. Anthropol. 30, 181-207.
- Zvelebil M. (2000) in Archaeogenetics: DNA and the Population Prehistory of Europe, eds. Renfrew, C. & Boyle, K. (McDonald Institute for Archaeological Research, Cambridge, U.K.), pp. 57–79.
- Whittle A., (1996) Europe in the Neolithic (Cambridge Univ. Press, Cambridge, U.K.).
- Menozzi P., Piazza, A. & Cavalli-Sforza, L. (1978) Science 201, 786-792. - PubMed
Publication types
MeSH terms
LinkOut - more resources
Full Text Sources
Miscellaneous

