Parallel identification of new genes in Saccharomyces cerevisiae - PubMed (original) (raw)
Parallel identification of new genes in Saccharomyces cerevisiae
Guy Oshiro et al. Genome Res. 2002 Aug.
Abstract
Short open reading frames (ORFs) occur frequently in primary genome sequence. Distinguishing bona fide small genes from the tens of thousands of short ORFs is one of the most challenging aspects of genome annotation. Direct experimental evidence is often required. Here we use a combination of expression profiling and mass spectrometry to verify the independent transcription of 138 and the translation of 50 previously nonannotated genes in the Saccharomyces cerevisiae genome. Through combined evidence, we propose the addition of 62 new genes to the genome and provide experimental support for the inclusion of 10 previously identified genes.
Figures
Figure 1
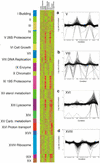
Transcriptional clusters identified by expression profiling over nine conditions. The data from the 18 different arrays were normalized such that the mean average difference for all genes was 200 (approximately two copies per cell). For clustering, the signals for each gene were normalized so that the median for all conditions was one. Representative clusters are shown in a_–_d, including clusters in which genes are induced after treatment with methyl methane sulfonate (MMS) and ultraviolet light (UV), induced after treatment with hydroxyurea (VIII), expressed on growth in glycerol-containing media (XVI), and repressed after treatment with MMS or UV (XVIII). For highly expressed genes, the fold change is likely to be underestimated because of the nonlinear response of the fluorescence signal at high concentrations. All data can be downloaded from
http://pub.gnf.org/∼ewinzeler/identification\_of\_new\_gene.htm
.
Figure 2
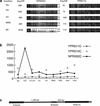
Transcriptional profile of the nonannotated open reading frame (NORF) NPR002C and the flanking neighboring genes YPR010C and YPR011C. (a) Array hybridization images. Each open reading frame (ORF) and NORF is represented on the S98 array by 16 oligonucleotide pairs. One member of each pair corresponds to a perfectly matched sequence from the ORF (PM); the other pair member contains a single-base mismatch in a central position (MM). The difference in intensity between the perfectly matched and the mismatched sequences (PM-MM) is used to calculate an “average difference intensity” for each ORF in each experiment. Array probe hybridization images for NORF NPR002C and ORF YPR011C from control cells in logarithmic phase growth, cells treated with HU, UV, MMS, and cells grown in glycerol containing media-treated cells are shown along with the average difference (Avg Diff) intensity values. (b) The average difference intensity of each gene graphed across all the conditions tested in this study. (c) Chromosomal view of NPR002C, YPR011C, and YPR010C with the distance in nucleotides between the NORF and ORF printed above the gap regions. The correlation of expression profiles between NPR002C and the upstream gene YPR011C and the downstream gene YPR010C is 0.13 and −0.32, respectively.
Figure 3
Northern blot analysis of NPR002C and YPR011C. (a) Expression of YPR011C across various conditions. RNA was extracted and total yeast RNA was separated by electrophoresis in an agarose gel, blotted, and hybridized with a polymerase chain reaction (PCR) amplicon of YPR011C. (b) The same blot was then stripped and hybridized with a PCR amplicon of NPR002C.
Figure 4
Homologs of NORF NNL005C are found in other species.
CLUSTAWL
alignment of homologous protein sequences from the mouse RIKEN cDNA 0610041E09 gene, Drosophila CG14199 gene, and the yeast NORF NNL005C. The mouse sequence scores (P < 8.3 × 10⁻²²) and the Drosophila sequence scores (P < 2.0 × 10⁻²⁰).
Figure 5
Mass spectra for a peptide from the NORF NIL001W. A multidimensional protein identification technology (MudPIT) analysis of the soluble proteome of BJ5460 was performed and the results analyzed via SEQUEST (Eng et al. 1994) using a concatenated database containing ORFs and NORFs. In the MudPIT analyses, a collision-induced dissociation tandem mass spectrum for (M + 2H) 2+ ion of the peptide DILDVLNLLK at m/z 578.5 from the NORF NIL001W was detected and identified. An eight-ion b and seven-ion y series are shown in red and blue, respectively, and the corresponding amino acid difference between each ion is shown. The SEQUEST result for the tandem mass spectrum shown had an Xcorr of 3.1276 and a ΔCn of 0.2292, indicating complete confidence in the SEQUEST result.
Similar articles
- Systematic discovery of new genes in the Saccharomyces cerevisiae genome.
Kessler MM, Zeng Q, Hogan S, Cook R, Morales AJ, Cottarel G. Kessler MM, et al. Genome Res. 2003 Feb;13(2):264-71. doi: 10.1101/gr.232903. Genome Res. 2003. PMID: 12566404 Free PMC article. - The sequence of a 17,933 bp segment of Saccharomyces cerevisiae chromosome XIV contains the RHO2, TOP2, MKT1 and END3 genes and five new open reading frames.
Soler-Mira A, Saiz JE, Ballesta JP, Remacha M. Soler-Mira A, et al. Yeast. 1996 Apr;12(5):485-91. doi: 10.1002/(sici)1097-0061(199604)12:5<485::aid-yea928>3.0.co;2-u. Yeast. 1996. PMID: 8740422 - Analysis of a 35.6 kb region on the right arm of Saccharomyces cerevisiae chromosome XV.
Bordonné R, Camasses A, Madania A, Poch O, Tarassov I, Winsor B, Martin R. Bordonné R, et al. Yeast. 1997 Jan;13(1):73-83. doi: 10.1002/(SICI)1097-0061(199701)13:1<73::AID-YEA52>3.0.CO;2-M. Yeast. 1997. PMID: 9046089 - Life with 6000 genes.
Goffeau A, Barrell BG, Bussey H, Davis RW, Dujon B, Feldmann H, Galibert F, Hoheisel JD, Jacq C, Johnston M, Louis EJ, Mewes HW, Murakami Y, Philippsen P, Tettelin H, Oliver SG. Goffeau A, et al. Science. 1996 Oct 25;274(5287):546, 563-7. doi: 10.1126/science.274.5287.546. Science. 1996. PMID: 8849441 Review. - Small open reading frames: current prediction techniques and future prospect.
Cheng H, Chan WS, Li Z, Wang D, Liu S, Zhou Y. Cheng H, et al. Curr Protein Pept Sci. 2011 Sep;12(6):503-7. doi: 10.2174/138920311796957667. Curr Protein Pept Sci. 2011. PMID: 21787300 Free PMC article. Review.
Cited by
- Protein analysis by shotgun/bottom-up proteomics.
Zhang Y, Fonslow BR, Shan B, Baek MC, Yates JR 3rd. Zhang Y, et al. Chem Rev. 2013 Apr 10;113(4):2343-94. doi: 10.1021/cr3003533. Epub 2013 Feb 26. Chem Rev. 2013. PMID: 23438204 Free PMC article. Review. No abstract available. - Gapped spectral dictionaries and their applications for database searches of tandem mass spectra.
Jeong K, Kim S, Bandeira N, Pevzner PA. Jeong K, et al. Mol Cell Proteomics. 2011 Jun;10(6):M110.002220. doi: 10.1074/mcp.M110.002220. Epub 2011 Mar 28. Mol Cell Proteomics. 2011. PMID: 21444829 Free PMC article. - Deep coverage of the Escherichia coli proteome enables the assessment of false discovery rates in simple proteogenomic experiments.
Krug K, Carpy A, Behrends G, Matic K, Soares NC, Macek B. Krug K, et al. Mol Cell Proteomics. 2013 Nov;12(11):3420-30. doi: 10.1074/mcp.M113.029165. Epub 2013 Aug 1. Mol Cell Proteomics. 2013. PMID: 23908556 Free PMC article. - A large-scale full-length cDNA analysis to explore the budding yeast transcriptome.
Miura F, Kawaguchi N, Sese J, Toyoda A, Hattori M, Morishita S, Ito T. Miura F, et al. Proc Natl Acad Sci U S A. 2006 Nov 21;103(47):17846-51. doi: 10.1073/pnas.0605645103. Epub 2006 Nov 13. Proc Natl Acad Sci U S A. 2006. PMID: 17101987 Free PMC article. - Proteogenomic analysis of pathogenic yeast Cryptococcus neoformans using high resolution mass spectrometry.
Nagarajha Selvan LD, Kaviyil JE, Nirujogi RS, Muthusamy B, Puttamallesh VN, Subbannayya T, Syed N, Radhakrishnan A, Kelkar DS, Ahmad S, Pinto SM, Kumar P, Madugundu AK, Nair B, Chatterjee A, Pandey A, Ravikumar R, Gowda H, Prasad TS. Nagarajha Selvan LD, et al. Clin Proteomics. 2014 Feb 3;11(1):5. doi: 10.1186/1559-0275-11-5. Clin Proteomics. 2014. PMID: 24484775 Free PMC article.
References
- Basrai MA, Hieter P, Boeke JD. Small open reading frames: Beautiful needles in the haystack. Genome Res. 1997;7:768–771. - PubMed
- Blandin G, Durrens P, Tekaia F, Aigle M, Bolotin-Fukuhara M, Bon E, Casaregola S, de Montigny J, Gaillardin C, Lepingle A, et al. Genomic exploration of the hemiascomycetous yeasts: 4. The genome of Saccharomyces cerevisiae revisited. FEBS Lett. 2000;487:31–36. - PubMed
Publication types
MeSH terms
Substances
Grants and funding
- R33CA81665-01/CA/NCI NIH HHS/United States
- T32 HG000035/HG/NHGRI NIH HHS/United States
- P41 RR011823/RR/NCRR NIH HHS/United States
- T32HG000035-05/HG/NHGRI NIH HHS/United States
- RR11823-03/RR/NCRR NIH HHS/United States
LinkOut - more resources
Full Text Sources
Other Literature Sources
Molecular Biology Databases


