Retinotopy and functional subdivision of human areas MT and MST - PubMed (original) (raw)
Clinical Trial
Retinotopy and functional subdivision of human areas MT and MST
Alexander C Huk et al. J Neurosci. 2002.
Abstract
We performed a series of functional magnetic resonance imaging experiments to divide the human MT+ complex into subregions that may be identified as homologs to a pair of macaque motion-responsive visual areas: the middle temporal area (MT) and the medial superior temporal area (MST). Using stimuli designed to tease apart differences in retinotopic organization and receptive field size, we established a double dissociation between two distinct MT+ subregions in 8 of the 10 hemispheres studied. The first subregion exhibited retinotopic organization but did not respond to peripheral ipsilateral stimulation, indicative of smaller receptive fields. Conversely, the second subregion within MT+ did not demonstrate retinotopic organization but did respond to peripheral stimuli in both the ipsilateral and contralateral visual hemifields, indicative of larger receptive fields. We tentatively identify these subregions as the human homologues of macaque MT and MST, respectively. Putative human MT and MST were typically located on the posterior/ventral and anterior/dorsal banks of a dorsal/posterior limb of the inferior temporal sulcus, similar to their relative positions in the macaque superior temporal sulcus.
Figures
Fig. 1.
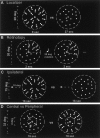
Stimuli. A, Moving versus stationary, localizing MT+. Area MT+ was identified based on responses to stimuli that alternated in time between moving (radially inward and outward from fixation, alternating direction every second, for 9 sec) and stationary (27 sec) dot patterns, while subjects fixated a small, high-contrast square in the center of the dot field. B, Retinotopy rotating wedge, identifying MT. The angular component of retinotopic organization was measured by having subjects fixate the center of a dot field with one-quarter of the field (a 90° wedge) containing moving dots. Every 2 sec, the wedge containing the moving dots rotated 20°, completing a full rotation every 36 sec.C, Ipsilateral stimulation, identifying MST. Responses to ipsilateral stimulation were assessed by presenting a peripheral dot patch in either the left or right visual field. The 15° diameter field of dots alternated between moving (18 sec) and stationary (18 sec), while subjects maintained fixation on a small, high-contrast square 10° from the nearest edge of the dot patch. D, Central versus peripheral visual field. The radial component of retinotopic organization was assessed by alternating moving dots within the central (4° outer radius) and peripheral (4° inner radius; 16.5° outer radius) parts of the visual field while subjects maintained central fixation.
Fig. 2.
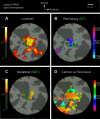
MT+ subdivision and retinotopy for subject A.R.W. (right hemisphere). A–D show fMRI responses on a 35-mm-radius flat map, centered within the fundus of the occipital continuation of the ITS. Green and cyan outlines indicate areas MT and MST. A, Response to MT+ localizer. A strong response is evident throughout MT+.Colors correspond to correlation values above threshold (r > 0.50). B, Response to retinotopy stimulus. The posterior subregion (MT) responded strongly to the rotating-wedge stimulus (green outline).Colors correspond to angular position in the visual field, given that responses are above the correlation threshold (r > 0.50). Note the smooth progression of phases from posterior–ventral to anterior–dorsal (cyan/blue, lower-left quadrant of visual field;magenta/red, upper-left quadrant). Responses corresponding to the ipsilateral visual field (which would be colored_green-yellow-orange_) were not observed at this correlation threshold, and thus are not evident on the flat map and have not been depicted in the color bar.C, Response to ipsilateral stimulus. The distinct, anterior subregion (MST) responded to ipsilateral stimulation (cyan outline). Colors correspond to correlation values above threshold (r > 0.60). D, Response to central versus peripheral stimulus. The ventral base of MT+ responded strongly to central stimulation, whereas the periphery was represented more dorsally. Colors correspond to the timing of response (phase), which corresponds to eccentric position (i.e., orange, central; blue, peripheral) in the visual field, given that responses are above the correlation threshold (r > 0.35). Representation of visual field eccentricity is indicated as central (Cen) or peripheral (Per). Scale bar, 10 mm.
Fig. 3.
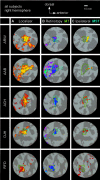
MT+ subdivision and retinotopy for all five subjects (right hemisphere). A–C, Responses to MT+ localizer, retinotopy, and ipsilateral stimuli, respectively (in the same format as Fig. 2_A–C_). MT is evident in all subjects, and MST is evident in all subjects except R.F.D. Correlation thresholds for localizer and retinotopy scans were as follows: A.R.W., 0.50; A.A.B., 0.52; A.C.H., 0.43; D.J.H., 0.55; and R.F.D., 0.42. Correlation thresholds for ipsilateral scans were as follows: A.R.W., 0.60; A.A.B., 0.65; A.C.H., 0.47; D.J.H., 0.36; and R.F.D., 0.29. Exact values of correlation thresholds were chosen for display; other correlation thresholds yielded similar results.
Fig. 4.
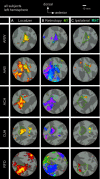
MT+ subdivision and retinotopy for all five subjects (left hemisphere). Format is the same as in Figure 3. MT is evident in all subjects, and MST is evident in all subjects except R.F.D. Correlation thresholds for localizer and retinotopy scans were as follows: A.R.W., 0.62; A.A.B., 0.51; A.C.H., 0.46; D.J.H., 0.62; and R.F.D., 0.23. Correlation thresholds for ipsilateral scans were as follows: A.R.W., 0.61; A.A.B., 0.54; A.C.H., 0.56; D.J.H., 0.64; and R.F.D., 0.40.
Fig. 5.
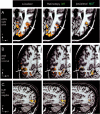
Spatial separation of retinotopy and ipsilateral responses in the cortical volume. A, fMRI responses shown in axial slices through the cortical volume (subject A.R.W., right hemisphere). The arrow indicates the center of the sulcus. Note that localizer responses (MT+) fall on both sides of the sulcus (left panel), retinotopy responses (MT) fall primarily on the posterior bank (middle panel), and ipsilateral responses (MST) are primarily restricted to the anterior bank (right panel).B, Coronal slices (subject A.A.B., left hemisphere, same format as in A). C, Sagittal slices (subject D.J.H., left hemisphere, same format as in A).A, Anterior; L, lateral;D, dorsal; M, medial; P, posterior.
Fig. 6.
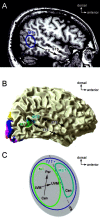
Proposed location of MT and MST in sagittal, 3D, and flattened views. A, Position of MT+ shown on a sagittal slice through the cortical volume. MT+ is indicated by a_blue outline_ in the ascending occipital continuation of the ITS. The STS is indicated for reference. B, Position of MT and MST, viewed on a 3D cortical reconstruction, for subject A.A.B. (left hemisphere). MT (green) falls on the posterior bank of the occipital continuation of the ITS, whereas MST (cyan) falls on the anterior bank. The STS is indicated for reference. Other visual areas are shown for reference: V1,red; V2, magenta; V3,blue; V3a/b, yellow. The image is reversed left to right to parallel A and_C_. C, Flat-map schematic of MT and MST. MT+ is outlined in blue, MT is outlined in_green_, and MST is outlined in cyan. Axes drawn within MT schematize the retinotopic organization observed, with more posterior/ventral portions representing the lower visual field (LVM) and more anterior/dorsal transition representing the upper visual field (UVM). Representation of visual field eccentricity is indicated as central (Cen) or peripheral (Per). The_dashed line_ indicates the fundus of a dorsal/posterior limb of the ITS.
Similar articles
- Distinguishing subregions of the human MT+ complex using visual fields and pursuit eye movements.
Dukelow SP, DeSouza JF, Culham JC, van den Berg AV, Menon RS, Vilis T. Dukelow SP, et al. J Neurophysiol. 2001 Oct;86(4):1991-2000. doi: 10.1152/jn.2001.86.4.1991. J Neurophysiol. 2001. PMID: 11600656 - Differential dependency on motion coherence in subregions of the human MT+ complex.
Becker HG, Erb M, Haarmeier T. Becker HG, et al. Eur J Neurosci. 2008 Oct;28(8):1674-85. doi: 10.1111/j.1460-9568.2008.06457.x. Eur J Neurosci. 2008. PMID: 18973585 - The retinotopic organization of the human middle temporal area MT/V5 and its cortical neighbors.
Kolster H, Peeters R, Orban GA. Kolster H, et al. J Neurosci. 2010 Jul 21;30(29):9801-20. doi: 10.1523/JNEUROSCI.2069-10.2010. J Neurosci. 2010. PMID: 20660263 Free PMC article. - Human V4 and ventral occipital retinotopic maps.
Winawer J, Witthoft N. Winawer J, et al. Vis Neurosci. 2015 Jan;32:E020. doi: 10.1017/S0952523815000176. Vis Neurosci. 2015. PMID: 26241699 Free PMC article. Review. - Cortical connections of MT in four species of primates: areal, modular, and retinotopic patterns.
Krubitzer LA, Kaas JH. Krubitzer LA, et al. Vis Neurosci. 1990 Aug;5(2):165-204. doi: 10.1017/s0952523800000213. Vis Neurosci. 1990. PMID: 2278944 Review.
Cited by
- Mapping the "What" and "Where" Visual Cortices and Their Atrophy in Alzheimer's Disease: Combined Activation Likelihood Estimation with Voxel-Based Morphometry.
Deng Y, Shi L, Lei Y, Liang P, Li K, Chu WC, Wang D; Alzheimer's Disease Neuroimaging Initiative. Deng Y, et al. Front Hum Neurosci. 2016 Jun 29;10:333. doi: 10.3389/fnhum.2016.00333. eCollection 2016. Front Hum Neurosci. 2016. PMID: 27445770 Free PMC article. - The functional role of the medial motion area V6.
Pitzalis S, Fattori P, Galletti C. Pitzalis S, et al. Front Behav Neurosci. 2013 Jan 16;6:91. doi: 10.3389/fnbeh.2012.00091. eCollection 2012. Front Behav Neurosci. 2013. PMID: 23335889 Free PMC article. - Selectivity to translational egomotion in human brain motion areas.
Pitzalis S, Sdoia S, Bultrini A, Committeri G, Di Russo F, Fattori P, Galletti C, Galati G. Pitzalis S, et al. PLoS One. 2013;8(4):e60241. doi: 10.1371/journal.pone.0060241. Epub 2013 Apr 5. PLoS One. 2013. PMID: 23577096 Free PMC article. - The perceived position of moving objects: transcranial magnetic stimulation of area MT+ reduces the flash-lag effect.
Maus GW, Ward J, Nijhawan R, Whitney D. Maus GW, et al. Cereb Cortex. 2013 Jan;23(1):241-7. doi: 10.1093/cercor/bhs021. Epub 2012 Feb 2. Cereb Cortex. 2013. PMID: 22302116 Free PMC article. - Perceptual Uncertainty Alternates Top-down and Bottom-up Fronto-Temporal Network Signaling during Response Inhibition.
Tsumura K, Shintaki R, Takeda M, Chikazoe J, Nakahara K, Jimura K. Tsumura K, et al. J Neurosci. 2022 Jun 1;42(22):4567-4579. doi: 10.1523/JNEUROSCI.2537-21.2022. Epub 2022 May 2. J Neurosci. 2022. PMID: 35501155 Free PMC article.
References
- Albright TD. Direction and orientation selectivity of neurons in visual area MT of the macaque. J Neurophysiol. 1984;52:1106–1130. - PubMed
- Albright TD, Desimone R. Local precision of visuotopic organization in the middle temporal area (MT) of the macaque. Exp Brain Res. 1987;65:582–592. - PubMed
- Albright TD, Desimone R, Gross CG. Columnar organization of directionally selective cells in visual area MT of the macaque. J Neurophysiol. 1984;51:16–31. - PubMed
- Allman JM, Kaas JH. A representation of the visual field in the caudal third of the middle temporal gyrus of the owl monkey (Aotus trivirgatus). Brain Res. 1971;31:85–105. - PubMed
- Boussaoud D, Desimone R, Ungerleider LG. Subcortical connections of visual areas MST and FST in macaques. Vis Neurosci. 1992;9:291–302. - PubMed
Publication types
MeSH terms
LinkOut - more resources
Full Text Sources
Other Literature Sources
