Profound effect of normalization on detection of differentially expressed genes in oligonucleotide microarray data analysis - PubMed (original) (raw)
Profound effect of normalization on detection of differentially expressed genes in oligonucleotide microarray data analysis
Reinhard Hoffmann et al. Genome Biol. 2002.
Abstract
Background: Oligonucleotide microarrays measure the relative transcript abundance of thousands of mRNAs in parallel. A large number of procedures for normalization and detection of differentially expressed genes have been proposed. However, the relative impact of these methods on the detection of differentially expressed genes remains to be determined.
Results: We have employed four different normalization methods and all possible combinations with three different statistical algorithms for detection of differentially expressed genes on a prototype dataset. The number of genes detected as differentially expressed differs by a factor of about three. Analysis of lists of genes detected as differentially expressed, and rank correlation coefficients for probability of differential expression shows that a high concordance between different methods can only be achieved by using the same normalization procedure.
Conclusions: Normalization has a profound influence of detection of differentially expressed genes. This influence is higher than that of three subsequent statistical analysis procedures examined. Algorithms incorporating more array-derived information than gene-expression values alone are urgently needed.
Figures
Figure 1
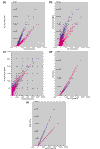
Pre- and post-normalization signal intensity scatterplots. The _x_-axis in all panels except (c) represents the not normalized average difference values (AD) derived from the Affymetrix GeneChip software after scanning. (a) _y_-axis is invariant-feature normalization with calculation of AD values. (b) _y_-axis is invariant-feature normalization with model-based expression values (MBEV). (c) _x_-axis is invariant-feature normalization with calculation of AD values; _y_-axis is invariant-feature normalization with MBEV. (d) _y_-axis is invariant probe set normalization. (e) _y_-axis is global scaling. Blue dots, subA-array; pink dots, subB-array.
Figure 2
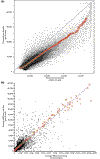
Invariant sets and normalization curves generated by nonlinear normalization methods using identical randomly chosen arrays, (a) Invariant-feature method, _x_-axis, Mature B cells, replicate 3, not normalized; _y_-axis, baseline: pre-BI cells, replicate 2. Black dots, feature intensities; red circles, invariant set of features (connected by the green line). The blue line forms the diagonal with slope of I. (b) Invariant set method. Cells as in (a). Black dots, probe set average difference values; red circles, invariant set. Blue dots form the diagonal with slope of I. Axes are labeled with average difference intensities.
Figure 3
Results of testing different combinations of analysis methods. (a) Numbers of genes reaching a 99% confidence level in all possible combinations of normalization and statistical analysis algorithms. _x_-axis, normalization methods; _y_-axis, statistical analysis algorithms. Column height, number of genes. (b) Percentage of genes from Figure 2a that additionally reach a ratio of at least 2 and an absolute difference of at least 100 units. Layout is as in Figure 2a. AD, average difference; F, F-statistics; KW, Kruskal-Wallis; MBEV, model-based expression values; significance analysis of microarrays (SAM).
Figure 4
Numbers of genes detected by one or more of the 12 possible combinations between normalization and statistical analysis. _x_-axis, count of different combinations between normalization and statistical algorithm, _y_-axis, number of genes detected as differentially expressed in the respective number of different analysis combinations. A total of 12 different analysis combinations (four normalization procedures times three methods to detect differentially expressed genes) have been investigated.
Similar articles
- Coex-Rank: An approach incorporating co-expression information for combined analysis of microarray data.
Cai J, Keen HL, Sigmund CD, Casavant TL. Cai J, et al. J Integr Bioinform. 2012 Jul 30;9(1):208. doi: 10.2390/biecoll-jib-2012-208. J Integr Bioinform. 2012. PMID: 22842118 Free PMC article. - Impact of DNA microarray data transformation on gene expression analysis - comparison of two normalization methods.
Schmidt MT, Handschuh L, Zyprych J, Szabelska A, Olejnik-Schmidt AK, Siatkowski I, Figlerowicz M. Schmidt MT, et al. Acta Biochim Pol. 2011;58(4):573-80. Epub 2011 Dec 20. Acta Biochim Pol. 2011. PMID: 22187680 - Normalization of boutique two-color microarrays with a high proportion of differentially expressed probes.
Oshlack A, Emslie D, Corcoran LM, Smyth GK. Oshlack A, et al. Genome Biol. 2007;8(1):R2. doi: 10.1186/gb-2007-8-1-r2. Genome Biol. 2007. PMID: 17204140 Free PMC article. - Normalization and quantification of differential expression in gene expression microarrays.
Steinhoff C, Vingron M. Steinhoff C, et al. Brief Bioinform. 2006 Jun;7(2):166-77. doi: 10.1093/bib/bbl002. Epub 2006 Mar 7. Brief Bioinform. 2006. PMID: 16772260 Review. - Transcriptome data analysis for cell culture processes.
Castro-Melchor M, Le H, Hu WS. Castro-Melchor M, et al. Adv Biochem Eng Biotechnol. 2012;127:27-70. doi: 10.1007/10_2011_116. Adv Biochem Eng Biotechnol. 2012. PMID: 22194060 Review.
Cited by
- ExpressYourself: A modular platform for processing and visualizing microarray data.
Luscombe NM, Royce TE, Bertone P, Echols N, Horak CE, Chang JT, Snyder M, Gerstein M. Luscombe NM, et al. Nucleic Acids Res. 2003 Jul 1;31(13):3477-82. doi: 10.1093/nar/gkg628. Nucleic Acids Res. 2003. PMID: 12824348 Free PMC article. - A new method for class prediction based on signed-rank algorithms applied to Affymetrix microarray experiments.
Rème T, Hose D, De Vos J, Vassal A, Poulain PO, Pantesco V, Goldschmidt H, Klein B. Rème T, et al. BMC Bioinformatics. 2008 Jan 11;9:16. doi: 10.1186/1471-2105-9-16. BMC Bioinformatics. 2008. PMID: 18190711 Free PMC article. - Different normalization strategies for microarray gene expression traits affect the heritability estimation.
Ma J, Qin ZS. Ma J, et al. BMC Proc. 2007;1 Suppl 1(Suppl 1):S154. doi: 10.1186/1753-6561-1-s1-s154. Epub 2007 Dec 18. BMC Proc. 2007. PMID: 18466499 Free PMC article. - Model selection and efficiency testing for normalization of cDNA microarray data.
Futschik M, Crompton T. Futschik M, et al. Genome Biol. 2004;5(8):R60. doi: 10.1186/gb-2004-5-8-r60. Epub 2004 Jul 30. Genome Biol. 2004. PMID: 15287982 Free PMC article. - Sex-biased gene expression in a ZW sex determination system.
Malone JH, Hawkins DL Jr, Michalak P. Malone JH, et al. J Mol Evol. 2006 Oct;63(4):427-36. doi: 10.1007/s00239-005-0263-4. Epub 2006 Oct 5. J Mol Evol. 2006. PMID: 17024524
References
- Lockhart DJ, Dong H, Byrne MC, Follettie MT, Gallo MV, Chee MS, Mittmann M, Wang C, Kobayashi M, Horton H, et al. Expression monitoring by hybridization to high-density oligonucleotide arrays. Nat Biotechnol. 1996;14:1675–1680. - PubMed
- Wodicka L, Dong H, Mittmann M, Ho MH, Lockhart DJ. Genome-wide expression monitoring in Saccharomyces cerevisiae. Nat Biotechnol. 1997;15:1359–1367. - PubMed
- Fambrough D, McClure K, Kazlauskas A, Lander ES. Diverse signaling pathways activated by growth factor receptors induce broadly overlapping, rather than independent, sets of genes. Cell. 1999;97:727–741. - PubMed
MeSH terms
Substances
LinkOut - more resources
Full Text Sources
Other Literature Sources
Medical


