Modulation of TCR-induced transcriptional profiles by ligation of CD28, ICOS, and CTLA-4 receptors - PubMed (original) (raw)
Modulation of TCR-induced transcriptional profiles by ligation of CD28, ICOS, and CTLA-4 receptors
James L Riley et al. Proc Natl Acad Sci U S A. 2002.
Abstract
Signals generated by T cell receptor (TCR) and CD28 engagement are required for optimal T cell activation, but how these signals integrate within the cell is still largely unknown. We have used near genome-scale expression profiling to monitor T cell signal transduction pathways triggered via TCR and/or costimulatory receptors. Ligation of CD28 alone induced a set of short-lived early response transcripts in both Jurkat T cells and primary CD4 T cells, thus providing evidence that CD28 engagement can affect gene regulation independently of TCR engagement. Simultaneous signaling through both the TCR and CD28 resulted in altered expression of several thousand genes following several distinct temporal patterns. Most of these gene regulations were induced by TCR signaling alone and were augmented to varying degrees by CD28 costimulation. CD28 and ICOS costimulation had nearly identical effects on gene regulation, but a few transcripts (e.g., IL2, IL9) were significantly more affected by CD28. Therefore, the distinctive functional outcomes of costimulation via CD28 and ICOS are accompanied by relatively few distinct differences in gene expression. Cytotoxic T lymphocyte antigen 4 (CTLA-4) engagement selectively blocked augmentation of gene regulations by CD28-mediated costimulation, but did not ablate gene regulation induced by TCR triggering alone.
Figures
Figure 1
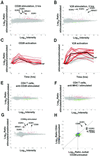
CD28 stimulation induces gene regulations in T cells. (A) CD28 stimulation induces gene regulations in Jurkat T cells. Jurkat T cells were left untreated or were stimulated with soluble anti-CD28 mAb for 2 h. Gene regulations induced by treatment were detected by competitive hybridization to ink-jet DNA microarrays. Plotted is the average from duplicate microarrays of the Cy5/Cy3 hybridization ratio for each oligonucleotide versus the hybridization intensity for that oligonucleotide. In this representation, the y axis is an estimation of the ratio of expression for a given transcript in stimulated/unstimulated cells, whereas the scale on the x axis is proportional to transcript abundance. Red and green pseudocolors indicate Cy5 and Cy3 labeling, respectively. Genes expressed significantly (P < 0.01) more in treated cells (up-regulated genes) are colored red; significantly down regulated genes are colored green; genes whose expression was not significantly altered during stimulation are colored gray. Consensus Jurkat CD28-induced genes (see Table 2) are indicated with error bars (±SD). Selected CD28-induced genes are flagged: EGR1, X52541; EGR2, J04076; EGR3, X63741; NR4A1, D49728. (_B_) TCR stimulation alone induces gene regulations in Jurkat T cells. Jurkat T cells were left untreated or were stimulated with plate-bound anti-Vβ8 mAb for 2 h. Detection of gene regulations by DNA microarray analysis was performed and depicted as in _A_. Consensus Jurkat CD28-induced genes are indicated as in _A_. (_C_) CD28-induced genes have immediate-early kinetics. Jurkat T cells were left untreated or were stimulated with soluble anti-CD28 mAb for 0, 0.25, 0.5, 12, 2, 4, and 8 h. Detection of gene regulations by DNA microarray analysis was performed as in _A_. Red curves depict the kinetics of regulation for consensus Jurkat CD28-induced genes. No additional genes were regulated >2-fold, P < 0.01 for at least two time points. Genes not significantly regulated are not depicted. Black line, TNF, tumor necrosis factor, X01394. (_D_) CD28-induced genes are a subset of TCR-induced genes. Jurkat T cells were left untreated or were stimulated with plate-bound anti-Vβ8 mAb as in _C_. Red curves depict the kinetics of regulation for consensus Jurkat CD28-induced genes in Vβ8-stimulated cells. Gray curves indicate hybridization ratios for additional Vβ8-induced genes showing 2-fold regulation; _P_ < 0.01 for at least two time points. Genes not significantly regulated are not depicted. (_E_) Anti-CD28 mAb induces gene expression changes in CD4 T cells. CD4 T cells were stimulated with anti-CD28 beads for 2 h. Consensus CD4 T cell CD86Ig-induced genes (see Table 2) are denoted with error bars. (_F_) CD28-induced genes are not induced by MHCI engagement in CD4 T cells. CD4 T cells were stimulated with anti-MHC beads for 2 h. Consensus CD4 CD28-induced genes are denoted with error bars. (_G_) CD28 stimulation by a natural ligand induces gene regulations in CD4 T cells. CD4 T cells were left untreated or were stimulated with CD86Ig beads for 2 h. Detection of gene regulations by DNA microarray analysis was performed and depicted as in _A_. Consensus CD4 T cell CD28-induced genes (see Table 2) are indicated with error bars (±SD). Selected CD28-induced genes are flagged as in _A_, with the addition of CD69, NM_001781. (_H_) Similar genes are induced by CD28 stimulation in Jurkat and CD4 T cells. Shown is a comparison (correlation) of genes significantly regulated (_P_ < 0.01, log10 intensity >−1) in anti-CD28-treated Jurkat T cells (A, x axis) versus CD86Ig-treated CD4 T cells (G, y axis). Red, genes significantly regulated under both conditions; green, genes significantly regulated in X dimension; blue, genes significantly regulated in Y dimension; brown, genes showing opposite regulation in the two conditions; gray, genes not significantly regulated in either dimension. Selected genes significantly induced under both conditions are flagged.
Figure 2
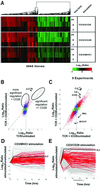
CD28 costimulation primarily induces quantitative rather than qualitative changes in transcript levels. (A) Overall similarity of gene regulations induced by stimulation of TCR alone, TCR plus CD28, and TCR plus ICOS. Human peripheral blood CD4 T cells were cultured for the indicated times with CD3/MHCI, CD3/CD28, or CD3/ICOS beads. Shown is a display of regulations from 3665 genes significantly regulated (P < 0.01, >2-fold regulation, log10 intensity >−1 in at least two experiments) over a total of nine experiments. The dendrogram depicts the similarity of co-regulation of the indicated genes, with the length of the “branches” proportional to the degree of similarity of co-regulation. This experiment was repeated twice with equivalent results. (B) CD28 costimulation induces changes in levels of most but not all transcripts induced by TCR stimulation. CD4 T cells were left untreated or were stimulated with CD3/MHCI or CD3/CD28 beads for 2 h as in Fig. 2_A_. Shown are comparisons (correlations) of genes significantly regulated (P < 0.01, intensity >−1) in CD3/MHCI stimulated T cells (x axis) versus CD3/CD28 stimulated T cells (y axis). The plot is colored as in Fig. 1_F_. The dotted diagonal line indicates the expected positions of gene regulated equally by both stimulation conditions and the vertical dotted line, genes regulated only with CD28 costimulation. Ovals identify genes significantly regulated with or without CD28 costimulation or genes showing more significant regulation with CD28 costimulation. Genes flagged red, blue, and brown showed similar patterns of regulation in an independent experiment; those flagged green were not reproducible. The positions of S82692 and NM_000586, and IL2, are indicated. (C) CD28 and ICOS costimulation induces similar regulation in all but a few transcripts. CD4 T cells were left untreated or were stimulated with CD3/CD28 or CD3/ICOS beads for 8 h as in Fig. 2_A_. Shown are comparisons (correlations) of genes significantly regulated (P < 0.01, log10 intensity >−1) in CD3/ICOS -treated T cells (x axis) versus CD3/CD28-treated T cells (y axis). The positions of selected off diagonal genes regulated much more highly following CD28 costimulation are indicated by arrows:IL2; NM_000590, IL9, interleukin 9; AB023135; ICOS, inducible co-stimulator; NM_002371, MAL, mal T cell differentiation protein; X98411, MYO1F, myosin 1F. (D and E) Genes showing increased regulation with CD28 at 2 h show slower kinetics of activation in cells stimulated with TCR alone. CD4 T cells were left untreated or were stimulated with CD3/MHCI or CD3/CD28 beads for 2, 8, or 24 h as in Fig. 3_A_. Shown is a representation of the kinetics of gene regulation by CD3/MHCI beads (D) and CD3/CD28 beads (E). Gray curves indicate hybridization ratios for genes showing 2-fold regulation; P < 0.01 for three time points. Red curves depict genes showing higher regulation following CD28 costimulation (>5-fold regulation, P < 1 × 10⁻⁴, approximately depicted by the labeled oval in Fig. 2_B_). Genes not significantly regulated are not depicted. The regulation of IL2 is shown for reference.
Figure 3
CTLA-4 engagement blocks CD28-induced changes in gene regulation. CD4 T cells were stimulated with CD3, CD3/CD28/CTLA-4, or CD3/CD28/MHC I beads for 2, 8, or 24 h. To see the effects of CTLA-4 engagement, 10-fold less anti-CD3 mAb was used to coat beads used these experiments. Detection of gene regulations by DNA microarray analysis was performed and depicted as in Fig. 2. Shown are regulations of 1,985 genes significantly regulated (P < 0.01, log10 intensity >−1, >2-fold regulation in two or more experiments). This experiment was repeated twice with equivalent results.
Similar articles
- Strength of TCR signal determines the costimulatory requirements for Th1 and Th2 CD4+ T cell differentiation.
Tao X, Constant S, Jorritsma P, Bottomly K. Tao X, et al. J Immunol. 1997 Dec 15;159(12):5956-63. J Immunol. 1997. PMID: 9550393 - Expression and functional significance of CTLA-4, a negative regulator of T cell activation.
Kosmaczewska A, Ciszak L, Boćko D, Frydecka I. Kosmaczewska A, et al. Arch Immunol Ther Exp (Warsz). 2001;49(1):39-46. Arch Immunol Ther Exp (Warsz). 2001. PMID: 11266089 Review. - The B7 family of ligands and its receptors: new pathways for costimulation and inhibition of immune responses.
Carreno BM, Collins M. Carreno BM, et al. Annu Rev Immunol. 2002;20:29-53. doi: 10.1146/annurev.immunol.20.091101.091806. Epub 2001 Oct 4. Annu Rev Immunol. 2002. PMID: 11861596 Review.
Cited by
- Exploring the Complexity and Promise of Tumor Immunotherapy in Drug Development.
Feng Y, He C, Liu C, Shao B, Wang D, Wu P. Feng Y, et al. Int J Mol Sci. 2024 Jun 11;25(12):6444. doi: 10.3390/ijms25126444. Int J Mol Sci. 2024. PMID: 38928150 Free PMC article. Review. - Critical role of the gut microbiota in immune responses and cancer immunotherapy.
Li Z, Xiong W, Liang Z, Wang J, Zeng Z, Kołat D, Li X, Zhou D, Xu X, Zhao L. Li Z, et al. J Hematol Oncol. 2024 May 14;17(1):33. doi: 10.1186/s13045-024-01541-w. J Hematol Oncol. 2024. PMID: 38745196 Free PMC article. Review. - Alternative 3'UTR expression induced by T cell activation is regulated in a temporal and signal dependent manner.
Blake D, Gazzara MR, Breuer I, Ferretti M, Lynch KW. Blake D, et al. Sci Rep. 2024 May 14;14(1):10987. doi: 10.1038/s41598-024-61951-1. Sci Rep. 2024. PMID: 38745101 Free PMC article. - Shared and distinct genetics of pure type 1 diabetes and type 1 diabetes with celiac disease, homology in their auto-antigens and immune dysregulation states: a study from North India.
Kaur N, Singh J, Minz RW, Anand S, Saikia B, Bhadada SK, Dayal D, Kumar M, Dhanda SK. Kaur N, et al. Acta Diabetol. 2024 Jun;61(6):791-805. doi: 10.1007/s00592-024-02258-5. Epub 2024 Mar 14. Acta Diabetol. 2024. PMID: 38483572 - Transcriptional reprogramming via signaling domains of CD2, CD28, and 4-1BB.
De Sousa Linhares A, Sharma S, Steinberger P, Leitner J. De Sousa Linhares A, et al. iScience. 2024 Feb 19;27(3):109267. doi: 10.1016/j.isci.2024.109267. eCollection 2024 Mar 15. iScience. 2024. PMID: 38455974 Free PMC article.
References
- Mueller D L, Jenkins M K, Schwartz R H. Annu Rev Immunol. 1989;7:445–480. - PubMed
- Matzinger P. Annu Rev Immunol. 1994;12:991–1045. - PubMed
- Glimcher L H, Murphy K M. Genes Dev. 2000;14:1693–1711. - PubMed
- Salomon B, Bluestone J A. Annu Rev Immunol. 2001;19:225–252. - PubMed
- Rudd C E. Immunity. 1996;4:527–534. - PubMed
MeSH terms
Substances
LinkOut - more resources
Full Text Sources
Other Literature Sources
Molecular Biology Databases
Research Materials


