Movement and crevices around a sodium channel S3 segment - PubMed (original) (raw)
Movement and crevices around a sodium channel S3 segment
Thao P Nguyen et al. J Gen Physiol. 2002 Sep.
Abstract
Voltage sensing is due mainly to the movement of positively charged S4 segments through the membrane electric field during changes of membrane potential. The roles of other transmembrane segments are under study. The S3 segment of domain 4 (D4/S3) in the sodium channel Na(v)1.4 carries two negatively charged residues and has been implicated in voltage-dependent gating. We substituted cysteines into nine putative "high impact" sites along the complete length of D4/S3 and evaluated their accessibilities to extracellular sulfhydryl reagents. Only the four outermost substituted cysteines (L1433C, L1431C, G1430C, and S1427C) are accessible to extracellular sulfhydryl reagents. We measured the voltage-dependent modification rates of the two cysteines situated at the extreme ends of this accessible region, L1433C and S1427C. Independent of the charge on the sulfhydryl reagents, depolarization increases the reactivity of both of these residues. Thus, the direction of the voltage dependence is opposite to that expected for a negatively charged voltage sensor, namely an inward translational movement in response to depolarization. Intrinsic electrostatic potentials were probed by charged sulfhydryl reagents and were either negative or positive, respectively, near L1433C and S1427C. The magnitude of the electrostatic potential near S1427C decreases with depolarization, suggesting that the extracellular crevice next to it widens during depolarization. S1427C experiences 44% of the electric field, as probed by charged cysteine reagents. To further explore movements around D4/S3, we labeled cysteines with the photoactivatable cross-linking reagent benzophenone-4-carboxamidocysteine methanethiosulfonate and examined the effects of UV irradiation on channel gating. After labeling with this reagent, all accessible cysteine mutants show altered gating upon brief UV irradiation. In each case, the apparent insertion efficiency of the photoactivated benzophenone increases with depolarization, indicating voltage-dependent movement near the extracellular end of D4/S3.
Figures
Figure 2.
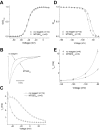
Perturbations in channel gating by cysteine mutations of the putative “high impact” face of Nav1.4 D4/S3. (A) Voltage-activation relations. Currents were elicited from a holding voltage of −140 mV to voltages between −55 and 65 mV in 5-mV increments. Symbols represent normalized whole cell conductances, obtained by dividing peak currents by the driving force. Solid curves are averages of single Boltzmann fits of normalized conductances from individual cells. (B) Fast inactivation. Inactivation time constants (τh) were obtained from fitting the current decay during depolarization measured in Fig. 2 A. A single exponential relaxation was performed for WT and most mutants; a double exponential relaxation for L1433C and G1430C. Only data in the range from −60 to 35 mV are shown. (C) Steady-state inactivation. Inactivation was induced from a holding voltage of −150 mV by a 100-ms conditioning pulse to a voltage between −180 and −30 mV in 10-mV increments. Solid curves are averages of single Boltzmann fits of normalized currents at a test pulse −25 mV from individual cells. (D) Recovery from fast inactivation. A triple pulse protocol, with a holding voltage of −140 mV and test pulses to −25 mV, was used to measure recovery from inactivation at different recovery potentials between −140 and −80 mV in 10-mV increments (or between −150 and −90 mV for G1430C). Recovery time constants (τrcv) were obtained from single exponential fits. Data and typical parameters derived from fits are listed in Table I. For all panels, n ≥ 3.
Figure 9.
Effect of δ cys on Ψi,−150. Modification rates were used to calculate ρV, initially at V = 0 mV to determine Ψi,0 (Eq. 2). δ cys was estimated from the ratio of ρ 0/ρV for positive values of V (Eq. 3). Ψi,−150 was calculated from measured values of ρ 2150 and Eq. 1, using three different values of δ cys: 0, 1, and the value of δ cys estimated at V = 0 mV (plotted symbols for each mutant). For L1433C and S1427C, the estimates of δ cys at 0 mV were 0.04 ± 0.07 and 0.44 ± 0.05, respectively. The theoretical lines show the predicted effect of δ cys, ranging from 0 to 1, on Ψi,−150. Standard errors were determined by propagation of errors (Bevington, 1969). The larger standard errors of Ψi,−150 for intermediate values of δ cys are a consequence of the propagation of errors in estimates of δ cys and the magnitude of V (−150 mV).
Figure 1.
(A) Sequence alignment of D4/S3 of the human skeletal muscle sodium channel Nav1.4 with S3 segments of Shaker and drk1 potassium channels. High impact residues in S3 of potassium channels and cysteine mutants in D4/S3 of sodium channel are underlined and bolded. The nine D4/S3 mutations are W1416C, N1417C, F1419C, D1420C, V1423C, S1427C, G1430C, L1431C, and L1433C. G1430 is also aligned with T268 in the brain mKv1.1 potassium channel (sequence not shown), which is also implicated in a role in gating (Planells-Cases et al., 1995). F1419 is aligned with a disease-associated phenylalanine residue in D4/S3 of the equine isoform of NaV1.4 (Cannon et al., 1995). Numbers indicate residue positions starting from the inside. The large box highlights the short kink postulated to separate the two helices (Li-Smerin and Swartz, 2001). The small box highlights the conserved Asp in S3. (B) α-helical net of D4/S3 in the human skeletal muscle sodium channel Nav1.4. The residues substituted to cysteines in this study are shown in black circles.
Figure 3.
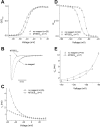
Effects of external MTSES on the gating properties of L1433C. Protocols were as described in Fig. 2. (A) Voltage-activation relations. (B) Scaled currents were activated by a depolarization from −140 to −40 mV. (C) Fast inactivation. While a single exponential fit was adequate to derive τh values for the “MTSESext” condition, a double exponential fit was required for the “no reagent” condition and the more heavily weighted component was plotted. (D) Steady-state inactivation. (E) Recovery from fast inactivation. Solid curves are averages of single exponential growth fits of the τrcv values at different potentials from individual cells. For all panels, n ≥ 3.
Figure 4.
Effects of external MTSES on the gating properties of S1427C. Protocols are described in Fig. 2. (A) Voltage-activation relations. (B) Scaled currents were activated by a depolarization from −140 to −40 mV. (C) Fast inactivation. (D) Steady-state inactivation. (E) Recovery from fast inactivation. For the “no reagent” condition, due to variation in the amplitudes of the exponential growth fits from individual cells at the most depolarized potentials, the solid curve shown was not an average of all the fits from individual cells (as in Fig. 3), but was instead a single exponential growth fit to the mean of the τrcv data from all cells. The two apparent gating charge δrcvs generated using either method (average of fits vs. fit of averages) were in good agreement (1.51 ± 0.05 [Table I] vs. 1.50, respectively). For the “MTSESext” condition, exponential growth fits could not be performed due to the loss of voltage dependence of τrcv. For all panels, n ≥ 7.
Figure 5.
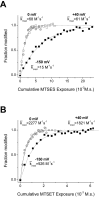
Normalized time course of L1433C modification by MTSES (A) and MTSET (B). Modification rates at -150 mV (closed squares) and 0 mV (open squares) and 40 mV (gray circles) were measured by tracking the MTS deceleration of inactivation. Data from representative individual cells were fit with single exponential relaxations, as shown. The k mod values shown for each voltage are mean values of all cells examined at that voltage.
Figure 6.
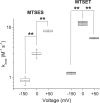
Voltage dependence of L1433C modification with MTS reagents. Box plots for k mod (n = 3–5). **P < 0.01.
Figure 7.
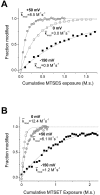
Normalized time course of S1427C modification by MTSES (A) and MTSET (B). Modification rates at −150 mV (closed squares) and 0 mV (open squares) and 50 mV (gray circles) were measured by tracking the MTS hyperpolarized shift of steady-state inactivation. Data from representative cells were fit with single exponential relaxations, as shown. The k mod values shown for each voltage are mean values of all cells examined at that voltage.
Figure 8.
Voltage dependence of S1427C modification with MTS reagents. Box plots for k mod (n = 3–5). **P < 0.01.
Figure 10.
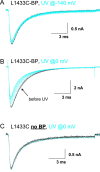
Photocross-linking L1433C. Cells in A and B were labeled with BPMTS. Black traces are controls before exposure to UV light. Blue traces were recorded after 2-s exposures to UV light applied either at −140 mV (A) or 0 mV (B and C). See
materials and methods
for details.
Figure 11.
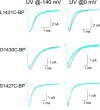
Photocross-linking L1431C-BP, G1430C-BP, and S1427C-BP. UV irradiation of BPMTS-labeled cells, as in Fig. 10.
Figure 12.
Crevice-widening model. Transmembrane segments S4–S6 are shown as cylinders, and S3 is shown as two cylinders separated by a kink (Li-Smerin and Swartz, 2001). The permeation pathway is to the right of the S6 segment. The S1 and S2 segments are not shown. The yellow balls represent cysteine substituted for either L1433C in the outer helix or S1427C in the kink. A crevice (exaggerated for clarity) is shown between the outer ends of S3 and S4. Depolarization causes an outward movement of S4 and a tilt toward the pore, widening the crevice between S3 and S4. S3 is shown as fixed, although it is likely that it moves in response to changes in the conformations of the transmembrane segments that abut it.
Similar articles
- Immobilizing the moving parts of voltage-gated ion channels.
Horn R, Ding S, Gruber HJ. Horn R, et al. J Gen Physiol. 2000 Sep;116(3):461-76. doi: 10.1085/jgp.116.3.461. J Gen Physiol. 2000. PMID: 10962021 Free PMC article. - Probing the outer vestibule of a sodium channel voltage sensor.
Yang N, George AL Jr, Horn R. Yang N, et al. Biophys J. 1997 Nov;73(5):2260-8. doi: 10.1016/S0006-3495(97)78258-4. Biophys J. 1997. PMID: 9370423 Free PMC article. - Changes in local S4 environment provide a voltage-sensing mechanism for mammalian hyperpolarization-activated HCN channels.
Bell DC, Yao H, Saenger RC, Riley JH, Siegelbaum SA. Bell DC, et al. J Gen Physiol. 2004 Jan;123(1):5-19. doi: 10.1085/jgp.200308918. Epub 2003 Dec 15. J Gen Physiol. 2004. PMID: 14676285 Free PMC article. - Molecular basis for function in sodium channels.
Horn R. Horn R. Novartis Found Symp. 2002;241:21-6; discussion 26-33, 226-32. Novartis Found Symp. 2002. PMID: 11771648 Review. - Molecular basis of K+ channel inactivation gating.
Isacoff EY, Jan YN, Jan LY. Isacoff EY, et al. EXS. 1993;63:338-51. doi: 10.1007/978-3-0348-7265-2_18. EXS. 1993. PMID: 8380732 Review.
Cited by
- Coupled movements in voltage-gated ion channels.
Horn R. Horn R. J Gen Physiol. 2002 Oct;120(4):449-53. doi: 10.1085/jgp.20028658. J Gen Physiol. 2002. PMID: 12356847 Free PMC article. Review. No abstract available. - Characterization of five RNA editing sites in Shab potassium channels.
Ryan MY, Maloney R, Reenan R, Horn R. Ryan MY, et al. Channels (Austin). 2008 May-Jun;2(3):202-9. doi: 10.4161/chan.2.3.6386. Epub 2008 May 2. Channels (Austin). 2008. PMID: 18836299 Free PMC article. - Interactions between lipids and voltage sensor paddles detected with tarantula toxins.
Milescu M, Bosmans F, Lee S, Alabi AA, Kim JI, Swartz KJ. Milescu M, et al. Nat Struct Mol Biol. 2009 Oct;16(10):1080-5. doi: 10.1038/nsmb.1679. Epub 2009 Sep 27. Nat Struct Mol Biol. 2009. PMID: 19783984 Free PMC article. - Ion channel voltage sensors: structure, function, and pathophysiology.
Catterall WA. Catterall WA. Neuron. 2010 Sep 23;67(6):915-28. doi: 10.1016/j.neuron.2010.08.021. Neuron. 2010. PMID: 20869590 Free PMC article. Review. - How ion channels sense membrane potential.
Horn R. Horn R. Proc Natl Acad Sci U S A. 2005 Apr 5;102(14):4929-30. doi: 10.1073/pnas.0501640102. Epub 2005 Mar 28. Proc Natl Acad Sci U S A. 2005. PMID: 15795366 Free PMC article. No abstract available.
References
- Bevington, P.R. 1969. Data Reduction and Error Analysis for the Physical Sciences. McGraw-Hill, New York. pp. 56–65.
- Bezanilla, F. 2000. The voltage sensor in voltage dependent ion channels. Physiol. Rev. 80:555–592. - PubMed
- Cannon, S.C., L.J. Hayward, J. Beech, and R.H. Brown, Jr. 1995. Sodium channel inactivation is impaired in equine hyperkalemic periodic paralysis. J. Neurophys. 73:1892–1899. - PubMed
- Cha, A., and F. Bezanilla. 1997. Characterizing voltage-dependent conformational changes in the Shaker K+ channel with fluorescence. Neuron. 19:1127–1140. - PubMed
- Ding, S., and R. Horn. 2001. Slow photo-cross-linking kinetics of benzophenone-labeled voltage sensors of ion channels. Biochemistry. 40:10707–10716. - PubMed


