Activation of STAT3 by the hepatitis C virus core protein leads to cellular transformation - PubMed (original) (raw)
Activation of STAT3 by the hepatitis C virus core protein leads to cellular transformation
Takafumi Yoshida et al. J Exp Med. 2002.
Abstract
The signal transducer and activator of transcription (STAT) family proteins are transcription factors critical in mediating cytokine signaling. Among them, STAT3 is often constitutively phosphorylated and activated in human cancers and in transformed cell lines and is implicated in tumorigenesis. However, cause of the persistent activation of STAT3 in human tumor cells is largely unknown. The hepatitis C virus (HCV) is a major etiological agent of non-A and non-B hepatitis, and chronic infection by HCV is associated with development of liver cirrhosis and hepatocellular carcinoma. HCV core protein is proposed to be responsible for the virus-induced transformation. We now report that HCV core protein directly interacts with and activates STAT3 through phosphorylation of the critical tyrosine residue. Activation of STAT3 by the HCV core in NIH-3T3 cells resulted in rapid proliferation and up-regulation of Bcl-XL and cyclin-D1. Additional expression of STAT3 in HCV core-expressing cells resulted in anchorage-independent growth and tumorigenesis. We propose that the HCV core protein cooperates with STAT3, which leads to cellular transformation.
Figures
Figure 1.
Proliferation and STAT3 activation of liver cells in HCV core protein Tg mice. (A) Representative immunohistochemical staining of Cyclin D1 in DEN-treated Px core Tg mouse and wild-type mouse liver tissue sections (original magnification, ×200). Cyclin D1–positive nuclei are in brown, and nonlabeled nuclei were counterstained with hematoxylin. In the right panel, the percentage of Cyclin D1–positive hepatocytes in DEN-treated mouse liver (n = 4). Mean values were determined by counting Cyclin D1–positive hepatocytes in five random fields of ∼250 cells per field. Error bars represent standard deviations. (B) Phosphorylation of STAT3. Two Tg mouse lines (core-Tg1 and core-Tg2; lanes 3, 4, 7, 8, and 10) and their littermates (non-Tg1 and non-Tg2; lanes 1, 2, 5, 6, and 9) were treated without (lanes 1–4, 9, 10) or with (lanes 5–8) DEN. 2 d later, liver cell extracts (20 μg protein/lane) were prepared and immunoblotted with anti-phospho-STAT3 (PY-STAT3), STAT3, phospho-STAT5 (PY-STAT5), STAT5, and HCV core antibodies.
Figure 2.
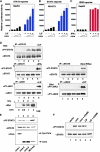
Activation of STAT3 by HCV core protein. (A–C) Reporter gene assay. HepG2 (A and C) or NIH-3T3 (B) cells were transfected with 0.5, 1, or 2 μg plasmid of the pcDNA3-Myc-core and then stimulated by either 10 ng/ml LIF (A and B) or 100 ng/ml IFNα (C) for 6 h. STAT3- (A and B) or ISRE- (C) dependent luciferase activity was measured. (D) Phosphorylation of STAT3 by the core protein. HepG2 cells were transfected with 0 (lanes 1 and 5), 0.5 (lane 2), 1 (lane 3), 2 (lane 4) μg of the core plasmid, and STAT3 (a), STAT1 (b), STAT5 (c), JAK1 (d), and JAK2 (e) were then immunoprecipitated. The immunoprecipitates were blotted with anti-phosphorylated forms-specific antibodies. As a positive control (lanes 5), cells were stimulated with LIF or IFNγ for STAT3, STAT1, and JAK1 phosphorylation. For STAT5, 293 cells transfected with the Erythropoietin (Epo) receptor (Epo-R) were stimulated with Epo. (E) Activation of STAT3 by three independent HCV core cDNAs and full-length HCV genomic DNA. pcDNA3-Myc-core (core-1, lane 1), pPx-core (core-2, lane 2), pEF-core (core-3, lane 3), and pCALN-HCV (HCV-full, lane 4) were transiently expressed in HepG2 cells then, total cell extracts were immunoblotted with indicated antibodies. (F) HepG2 cells transfected with empty vector pcDNA3-Myc (lane 1) or with pcDNA3-Myc-core (lanes 2 and 3) or untransfected cells (lanes 4 and 5) were treated without (lanes 1–3) or with (lanes 5 and 6) 10 ng/ml LIF for 3 h, then further incubated with (lanes 3 and 5) or without (lanes 1, 2, and 4) AG490 (50 μM) for 6 h. Total cell extracts were immuno-blotted with anti-PY-STAT3 or anti-STAT3 antibodies.
Figure 5.
Effect of the HCV core on the proliferation of NIH-3T3 cells. (A) NIH-3T3 cells were infected with a retrovirus vector carrying the core (pMX-core) or control virus (pMX), then plated into 35 mm dishes and the cell number was counted daily under normal growth conditions. The mean cell number with standard error of triplicate experiments is shown. (B) Total cell extracts from parental NIH-3T3 cells (parent) or infected cells were immunoblotted with anti-phospho-STAT3 or anti-STAT3. (C) The NIH-3T3 cells infected with a pMX-core retrovirus vector (NIH-3T3/core) were further infected with adenovirus carrying lacZ, SOCS3, and Y705F-STAT3 (dnSTAT3) at MOI 50. After infection, the cells were plated and scored daily (triplicate experiments). (D) Total cell extracts of infected cells were blotted with anti-phospho-STAT3, anti-STAT3 or anti-SOCS3.
Figure 3.
Interaction between the core protein and STAT3. (A) In vitro binding experiment. HepG2 cell extracts stimulated with (+) or without (−) LIF were incubated with either GST or GST-core bound to glutathione-Sepharose. Aliquots of total cell extracts (TCL) and proteins bound to the beads were immunoblotted with anti-STAT3, anti-NF-κB p65, and anti-ERK2 antibodies. Purified GST and GST-core fusion protein (0.1 μg protein) was also blotted with anti-GST. (B) Schematic diagrams of structural domains and deletion mutants of STAT3. (C) Flag-tagged STAT3 deletion mutants and the myc-tagged core were coexpressed in 293 cells and then immunoprecipitated with either anti-Myc or anti-Flag antibodies. The total cell extracts (TCL) or immunoprecipitates (IP) were blotted with anti-Myc or anti-Flag antibodies. To confirm the lack of binding between the core protein and ΔL-TA construct, data of a separate experiment are shown in the right (exp. 2). (D) Schematic diagrams of the deletion construct of the core protein. (E) HepG2 cells were transfected with an APRE-luciferase reporter gene and an increased amount of indicated core deletion mutants. After 24 h transfection, luciferase activity was measured. (F) The 293 cells were transfected with flag-tagged STAT3 and myc-tagged core deletion mutants. Immunoprecipitates with anti-Myc antibody or TCL were blotted with anti-Flag and anti-Myc antibodies.
Figure 4.
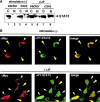
Nuclear localization of STAT3 (A and B) and time course of dephosphorylation of STAT3 (C). HepG2 cells transfected with empty vector (lanes 1, 2, 5, and 6) or pcDNA3-Myc-core (lanes 3, 4, 7, and 8) were stimulated without (lanes 1–4) or with (lanes 5–8) 10 ng/ml LIF for 30 min. Nuclear (N) and cytoplasmic (C) extracts (20 μg each) were analyzed by immunoblotting with anti-STAT3 antibody. (B) HepG2 cells were transfected with Myc-tagged core cDNA and then immunostained with anti-myc (monoclonal; red) or anti-phosphorylated STAT3 (polyclonal; green) antibodies followed by incubation with FITC-and Cy3-conjugated secondary antibodies. White arrowheads indicate the position of core-transfected cells, and yellow arrowheads indicate nontransfected cells. Similar results were obtained by at least three independent experiments. (C) Time course of dephosphorylation. HepG2 cells transfected with or without the core cDNA (transfection efficiency was >60%) were stimulated with 10 ng/ml LIF for 30 min before cycloheximide (CHX) treatment. The cells were washed and incubated without LIF in the presence of 100 μg/ml CHX for the indicated periods. The immunoprecipitates with anti-STAT3 antibody were analyzed by immunoblotting with the indicated antibodies. The levels of phosphorylated STAT3 in nontransfected (open circle) and transfected (closed circle) cells were quantitated by densitometry of the immunoblots using NIH Image software.
Figure 6.
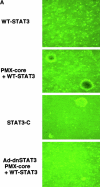
Transforming potential of WT-STAT3 and core-transfected cells. (A) NIH-3T3 cells or cells infected with the pMX-core were transfected with WT-STAT3 or STAT3-C and plated into soft agar and photographed on day 10. In the lowest panel, cells were infected with adenovirus carrying dnSTAT3 (Ad-dnSTAT3) at MOI = 50. (B) The levels of endogenous and exogenous STAT3 in NIH-3T3 and comparison with HepG2 cells. The same amount of cell extracts (15 μg protein/lane) from parental 3T3, two independent transformants expressing the core and WT-STAT3 (core + WT-STAT3) and HepG2 cells were immunoblotted with anti-STAT3 antibody. Linearity of the intensity of the band was observed between 5–40 μg protein. (C) The effect of adenovirus on the plating efficiency of cells lines expressing WT-STAT3/core derived from soft agar. 106 cells were infected with the indicated adenovirus (MOI = 50) and cultured for 10 d. Colonies 0.1 mm or greater were scored.
Figure 8.
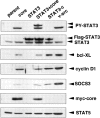
Cell extracts were prepared from parental NIH-3T3 cells (parent; lane 1), core-infected cells (core) (lane 2), and representative clones isolated from soft agar (STAT3 + core [lane 4], STAT3-C [lane 5], and v-src [lane 6]), and NIH-3T3 transformant expressing WT-STAT3 (lane 3), then immunoblotted with the indicated antibodies.
Figure 7.
Tumorigenicity of cells transformed of WT-STAT3 and core-transfected cells. (A) WT-STAT3/core or STAT3-C transformed cell lines were injected into nude mice, and the mice were photographed 3 wk later. (B) Paraffin sections from WT-STAT3/core, Stat3-C and _v-src_-containing tumors were stained with hematoxylin and eosin and viewed at 400× magnification.
Similar articles
- Hepatitis C virus NS5A mediated STAT3 activation requires co-operation of Jak1 kinase.
Sarcar B, Ghosh AK, Steele R, Ray R, Ray RB. Sarcar B, et al. Virology. 2004 Apr 25;322(1):51-60. doi: 10.1016/j.virol.2004.01.008. Virology. 2004. PMID: 15063116 - Expression of hepatitis c virus proteins inhibits interferon alpha signaling in the liver of transgenic mice.
Blindenbacher A, Duong FH, Hunziker L, Stutvoet ST, Wang X, Terracciano L, Moradpour D, Blum HE, Alonzi T, Tripodi M, La Monica N, Heim MH. Blindenbacher A, et al. Gastroenterology. 2003 May;124(5):1465-75. doi: 10.1016/s0016-5085(03)00290-7. Gastroenterology. 2003. PMID: 12730885 - Hepatitis C virus core protein-induced loss of LZIP function correlates with cellular transformation.
Jin DY, Wang HL, Zhou Y, Chun AC, Kibler KV, Hou YD, Kung H, Jeang KT. Jin DY, et al. EMBO J. 2000 Feb 15;19(4):729-40. doi: 10.1093/emboj/19.4.729. EMBO J. 2000. PMID: 10675342 Free PMC article. - The role of STATs in transcriptional control and their impact on cellular function.
Bromberg J, Darnell JE Jr. Bromberg J, et al. Oncogene. 2000 May 15;19(21):2468-73. doi: 10.1038/sj.onc.1203476. Oncogene. 2000. PMID: 10851045 Review. - Endoplasmic reticulum (ER) stress: hepatitis C virus induces an ER-nucleus signal transduction pathway and activates NF-kappaB and STAT-3.
Waris G, Tardif KD, Siddiqui A. Waris G, et al. Biochem Pharmacol. 2002 Nov 15;64(10):1425-30. doi: 10.1016/s0006-2952(02)01300-x. Biochem Pharmacol. 2002. PMID: 12417255 Review.
Cited by
- The Dynamic Interface of Viruses with STATs.
Harrison AR, Moseley GW. Harrison AR, et al. J Virol. 2020 Oct 27;94(22):e00856-20. doi: 10.1128/JVI.00856-20. Print 2020 Oct 27. J Virol. 2020. PMID: 32847860 Free PMC article. Review. - Transcriptional Regulatory Networks in Hepatitis C Virus-induced Hepatocellular Carcinoma.
Zahra M, Azzazy H, Moustafa A. Zahra M, et al. Sci Rep. 2018 Sep 24;8(1):14234. doi: 10.1038/s41598-018-32464-5. Sci Rep. 2018. PMID: 30250040 Free PMC article. - Repeated hepatocyte injury promotes hepatic tumorigenesis in hepatitis C virus transgenic mice.
Kato T, Miyamoto M, Date T, Yasui K, Taya C, Yonekawa H, Ohue C, Yagi S, Seki E, Hirano T, Fujimoto J, Shirai T, Wakita T. Kato T, et al. Cancer Sci. 2003 Aug;94(8):679-85. doi: 10.1111/j.1349-7006.2003.tb01502.x. Cancer Sci. 2003. PMID: 12901792 Free PMC article. - Viruses and human cancers: a long road of discovery of molecular paradigms.
White MK, Pagano JS, Khalili K. White MK, et al. Clin Microbiol Rev. 2014 Jul;27(3):463-81. doi: 10.1128/CMR.00124-13. Clin Microbiol Rev. 2014. PMID: 24982317 Free PMC article. Review. - Hepatitis C virus-associated pruritus: Etiopathogenesis and therapeutic strategies.
Alhmada Y, Selimovic D, Murad F, Hassan SL, Haikel Y, Megahed M, Hannig M, Hassan M. Alhmada Y, et al. World J Gastroenterol. 2017 Feb 7;23(5):743-750. doi: 10.3748/wjg.v23.i5.743. World J Gastroenterol. 2017. PMID: 28223719 Free PMC article. Review.
References
- Darnell, J.E., Jr. 1997. STATs and gene regulation. Science. 277:1630–1635. - PubMed
- Stark, G.R., I.M. Kerr, B.R. Williams, R.H. Silverman, and R.D. Schreiber. 1998. How cells respond to interferons. Annu. Rev. Biochem. 67:227–264. - PubMed
- Ihle, J.N. 1995. Cytokine receptor signaling. Nature. 377:591–594. - PubMed
- Bromberg, J.F., and J.E. Darnell, Jr. 2000. The role of STATs in transcriptional control and their impact on cellular function. Oncogene. 19:2468–2473. - PubMed
- Yu, C.L., D. Meyer, G.S. Campbell, A.C. Larner, C. Carter-Su, J. Schwartz, and R. Jove. 1995. Enhanced DNA-binding of a Stat3-related protein in cells transformed by the src oncoprotein. Science. 269:81–83. - PubMed
Publication types
MeSH terms
Substances
LinkOut - more resources
Full Text Sources
Other Literature Sources
Molecular Biology Databases
Research Materials
Miscellaneous


