Patterns of positive selection in the complete NBS-LRR gene family of Arabidopsis thaliana - PubMed (original) (raw)
Patterns of positive selection in the complete NBS-LRR gene family of Arabidopsis thaliana
Mariana Mondragón-Palomino et al. Genome Res. 2002 Sep.
Abstract
Plant disease resistance genes have been shown to be subject to positive selection, particularly in the leucine rich repeat (LRR) region that may determine resistance specificity. We performed a genome-wide analysis of positive selection in members of the nucleotide binding site (NBS)-LRR gene family of Arabidopsis thaliana. Analyses were possible for 103 of 163 NBS-LRR nucleotide sequences in the genome, and the analyses uncovered substantial evidence of positive selection. Sites under positive selection were detected and identified for 10 sequence groups representing 53 NBS-LRR sequences. Functionally characterized Arabidopsis resistance genes were in these 10 groups, but several groups with extensive evidence of positive selection contained no previously characterized resistance genes. Amino acid residues under positive selection were identified, and these residues were mapped onto protein secondary structure. Positively selected positions were disproportionately located in the LRR domain (P < 0.001), particularly a nine-amino acid beta-strand submotif that is likely to be solvent exposed. However, a substantial proportion (30%) of positively selected sites were located outside LRRs, suggesting that regions other than the LRR may function in determining resistance specificity. Because of the unusual sequence variability in the LRRs of this class of proteins, secondary-structure analysis identifies LRRs that are not identified by similarity analyses alone. LRRs also contain substantial indel variation, suggesting elasticity in LRR length could also influence resistance specificity.
Figures
Figure 1
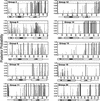
The posterior probability for sites in the positively selected class (ω > 1). Each graph represents 1 of the 10 sequence groups for which positive selection was detected by comparison of M7 and M8. The _X_-axis denotes position in the amino acid alignment. Sites with black bars had a posterior probability >0.9 under M8; sites with gray bars did not have posterior probabilities >0.9. Boxes under each graph denote domain structures of nucleotide sequences in the group, as identified either by Pfam (groups 2, 8, 9, 11, and 12) or by comparison to groups containing previously described R genes (groups 10, 14, 15, 18, and 20).
Figure 2
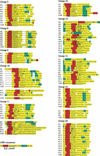
Secondary-structure predictions for LRRs from four groups with the highest number of positively selected sites. R# on left indicates the ordinal number for each LRR, and the sequence within each LRR represents the consensus from the alignment. Secondary-structure predictions are colored (yellow, coil; red, β-sheet; and blue, α-helix). The positions in which positive selection was detected are in bold and the sites that are part of the E4C5 motif are underlined. CON is the consensus sequence among LRRs for each group. Amino acids represented in uppercase are invariant among sequences. Notation for variable amino acid sites are as follows: X, any amino acid; 1, D,N; 2, E,Q; 3, S,T; 4, K,R; 5, F,Y,W; and 6, L,I,V,M. Dashes are gaps introduced to better align consensus LRRs and do not necessarily represent gaps in the original sequence alignments. In group 11, repeats 5, 6, 7, 8, 10, and 11 were defined by their predicted secondary structure. Similarly, repeats 1, 5, and 9 of group 18 were defined by predicted secondary structure. For other groups, LRRs were defined either by Pfam or by their similarity to characterized R genes.
Figure 3
A model of the evolutionary processes in LRRs that generate novel resistance specificities. (A) Indels in the backbone of the LRR domain. (B) Hypervariability in the E4C5 region. (C) Expansion/contraction in the overall number of LRR units. (D) Changes in secondary structure resulting from amino acid changes outside of the E4C5 region.
Similar articles
- Diversity in nucleotide binding site-leucine-rich repeat genes in cereals.
Bai J, Pennill LA, Ning J, Lee SW, Ramalingam J, Webb CA, Zhao B, Sun Q, Nelson JC, Leach JE, Hulbert SH. Bai J, et al. Genome Res. 2002 Dec;12(12):1871-84. doi: 10.1101/gr.454902. Genome Res. 2002. PMID: 12466291 Free PMC article. - Genome-wide analysis of NBS-LRR-encoding genes in Arabidopsis.
Meyers BC, Kozik A, Griego A, Kuang H, Michelmore RW. Meyers BC, et al. Plant Cell. 2003 Apr;15(4):809-34. doi: 10.1105/tpc.009308. Plant Cell. 2003. PMID: 12671079 Free PMC article. - Genome-wide identification of NBS genes in japonica rice reveals significant expansion of divergent non-TIR NBS-LRR genes.
Zhou T, Wang Y, Chen JQ, Araki H, Jing Z, Jiang K, Shen J, Tian D. Zhou T, et al. Mol Genet Genomics. 2004 May;271(4):402-15. doi: 10.1007/s00438-004-0990-z. Epub 2004 Mar 10. Mol Genet Genomics. 2004. PMID: 15014983 - The genetic architecture of resistance.
Young ND. Young ND. Curr Opin Plant Biol. 2000 Aug;3(4):285-90. doi: 10.1016/s1369-5266(00)00081-9. Curr Opin Plant Biol. 2000. PMID: 10873848 Review. - Tandem and segmental gene duplication and recombination in the evolution of plant disease resistance gene.
Leister D. Leister D. Trends Genet. 2004 Mar;20(3):116-22. doi: 10.1016/j.tig.2004.01.007. Trends Genet. 2004. PMID: 15049302 Review.
Cited by
- Global whole-genome comparison and analysis to classify subpopulations and identify resistance genes in weedy rice relevant for improving crops.
Han Z, Li F, Qiao W, Zheng X, Cheng Y, Zhang L, Huang J, Wang Y, Lou D, Xing M, Fan W, Nie Y, Guo W, Wang S, Liu Z, Yang Q. Han Z, et al. Front Plant Sci. 2023 Jan 10;13:1089445. doi: 10.3389/fpls.2022.1089445. eCollection 2022. Front Plant Sci. 2023. PMID: 36704170 Free PMC article. - Selection on amino acid substitutions in Arabidopsis.
Foxe JP, Dar VU, Zheng H, Nordborg M, Gaut BS, Wright SI. Foxe JP, et al. Mol Biol Evol. 2008 Jul;25(7):1375-83. doi: 10.1093/molbev/msn079. Epub 2008 Apr 4. Mol Biol Evol. 2008. PMID: 18390851 Free PMC article. - Recognition events and host-pathogen co-evolution in gene-for-gene resistance to flax rust.
Dodds P, Thrall P. Dodds P, et al. Funct Plant Biol. 2009;36(5):395-408. doi: 10.1071/FP08320. Funct Plant Biol. 2009. PMID: 21760756 Free PMC article. - Ancient diversity of splicing motifs and protein surfaces in the wild emmer wheat (Triticum dicoccoides) LR10 coiled coil (CC) and leucine-rich repeat (LRR) domains.
Sela H, Spiridon LN, Petrescu AJ, Akerman M, Mandel-Gutfreund Y, Nevo E, Loutre C, Keller B, Schulman AH, Fahima T. Sela H, et al. Mol Plant Pathol. 2012 Apr;13(3):276-87. doi: 10.1111/j.1364-3703.2011.00744.x. Epub 2011 Sep 23. Mol Plant Pathol. 2012. PMID: 21952112 Free PMC article. - Diversification of defensins and NLRs in Arabidopsis species by different evolutionary mechanisms.
Mondragón-Palomino M, Stam R, John-Arputharaj A, Dresselhaus T. Mondragón-Palomino M, et al. BMC Evol Biol. 2017 Dec 15;17(1):255. doi: 10.1186/s12862-017-1099-4. BMC Evol Biol. 2017. PMID: 29246101 Free PMC article.
References
- Anisimova M, Bielawski JP, Yang Z. Accuracy and power of the likelihood ratio test in detecting adaptive molecular evolution. Mol Bio Evol. 2001;18:1585–1592. - PubMed
- Baldi P, Brunak S, Frasconi P, Soda G, Pollastri G. Exploiting the past and the future in protein secondary structure prediction. Bioinformatics. 1999;15:937–946. - PubMed
- Bergelson J, Kreitman M, Stahl EA, Tian D. Evolutionary dynamics of plant R-genes. Science. 2001;292:2281–2285. - PubMed
Publication types
MeSH terms
Substances
LinkOut - more resources
Full Text Sources
Other Literature Sources
Research Materials
Miscellaneous


