In vivo kinetics of mRNA splicing and transport in mammalian cells - PubMed (original) (raw)
In vivo kinetics of mRNA splicing and transport in mammalian cells
A Audibert et al. Mol Cell Biol. 2002 Oct.
Abstract
The kinetics of pre-mRNA processing in living cells is poorly known, preventing a detailed analysis of the regulation of these reactions. Using tetracycline-regulated promoters we performed, during a transcriptional induction, a complete analysis of the maturation of two cellular mRNAs, those for LT-alpha and beta-globin. In both cases, splicing was appropriately described by first-order reactions with corresponding half-lives ranging between 0.4 and 7.5 min, depending on the intron. Transport also behaved as a first-order reaction during the early phase of beta-globin expression, with a nuclear dwelling time of 4 min. At a later time, analysis was prevented by the progressive accumulation within the nucleus of mature mRNA not directly involved in export. Our results further establish for these genes that (i) splicing components are never limiting, even when expression is induced in naive cells, (ii) there is no significant RNA degradation during splicing and transport, and (iii) precursor-to-product ratios at steady state can be used for the determination of splicing rates. Finally, the comparison between the kinetics of splicing during transcriptional induction and during transcriptional shutoff reveals a novel coupling between transcription and splicing.
Figures
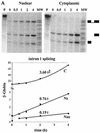
FIG. 1.
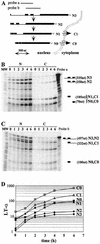
Kinetics of LT-α RNA accumulation following resumption of transcription. (A) Schematic representation of LT-α mRNA processing. Pre-mRNA (_N_3), experimentally observed partially spliced RNA (_N_2, _N_1, and _C_1) and fully spliced mRNA (_N_0 and _C_0) are represented. Probes a and b, LT-α genomic probes used for RNase protection assays. The scale is indicated at the bottom. (B and C) Analysis of LT-α transcripts by RNase protection assay. After a 24-h culture in the presence of 80 ng of tetracycline/ml, NIH 3T3-LT-α cells were extensively washed and incubated in the absence of tetracycline for 0 to 6 h. Equal amounts of nuclear (N) and cytoplasmic (C) RNA were hybridized with LT-α probes a (B) and b (C) in order to analyze the presence of introns 1 and 2 and introns 2 and 3, respectively. Migration of the riboprobe fragments protected by partially and fully spliced transcripts is indicated on the right. The molecular weight marker (MW) is pBr322 DNA digested with _Msp_I. (D) Quantification of nuclear and cytoplasmic LT-α transcripts. LT-α signals were quantified and corrected for the number of labeled uridines in each fragment. _N_0, _C_0, _N_1, and _C_1 values were directly obtained from RNase mapping assay with probe b. The ratio between _N_2 and _N_3 was obtained from the RNase mapping assay with probe a and was used to calculate the participation of _N_2 and _N_3 in the longest fragment protected with probe b. Results were corrected for the relative sizes of the nuclear and cytoplasmic compartments and expressed with arbitrary units. Note that the y axis is on a logarithmic scale and that the basal level of expression has not been subtracted.
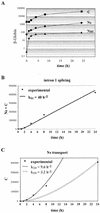
FIG. 2.
Determination of LT-α splicing and transport rates by computer simulation. (A) Representation of splicing and transport reactions. Reactions were assumed to follow first-order kinetics, with kS and kT being the rates for splicing and transport reactions, respectively. (B) Computer simulation of the production of LT-α transcripts. For intron 1 splicing, the kinetics of accumulation of all the transcripts generated from the N3 precursor was calculated for different values of kS1, taking into account the experimental pool of _N_3, as described in Materials and Methods. Results were plotted along with the experimentally observed accumulation of these transcripts (_N_2 + _N_1 + _N_0 + _C_1 + _C_0). Only the best fit, obtained with a splicing rate of 48 h−1, is presented. Similarly, for the following splicing and transport reactions, the accumulation of products was calculated taking into account the experimental pool of precursor and various splicing and transport rates. Black lines, best fits; grey lines (intron 3 splicing), simulations obtained by increasing or decreasing by 20% the splicing rate. For _N_0 transport, no satisfying fit could be found and two examples fitting either the early or the late time points are presented.
FIG. 3.
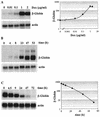
β-globin mRNA induction by doxycycline in HeLa rtTA cells. (A) Dose response to doxycycline. HeLa-β-glo cells were grown with the indicated doxycycline concentrations for 48 h. Equal amounts of total RNA were analyzed by Northern blotting with a β-globin probe and reanalyzed with a β-actin probe. The β-globin signals were quantified, corrected for equal loading by using β-actin signals, and plotted as a function of doxycycline concentration. Note that both axes are on a logarithmic scale. (B) Kinetics of β-globin mRNA accumulation following induction. Cells were treated with 2 μg of doxycycline/ml for the indicated periods of time. β-Globin mRNAs were analyzed as described for panel A. (C) Half-life of β-globin mRNA following arrest of transcription. Cells were cultivated for 3 days with 1 μg of doxycycline/ml, extensively washed, transferred to new dishes, and grown in the absence of doxycycline for the indicated periods of time. β-Globin mRNAs were analyzed and quantified as described for panel A, and levels were plotted as a function of time. Note that the y axis is on a logarithmic scale.
FIG. 4.
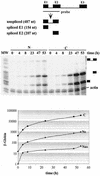
Kinetics of accumulation of the β-globin mRNA and its precursors following induction with doxycycline. HeLa-β-glo cells were treated with 2 μg of doxycycline/ml for the indicated periods of time. Equal amounts of nuclear (N) and cytoplasmic (C) RNA were hybridized with a β-globin probe encompassing intron 1 and analyzed by RNase protection assay. The fragments protected by spliced and unspliced transcripts are shown schematically at the top. Their expected migration is indicated at the right of the gel. A β-actin riboprobe was included in the hybridization to control for equal loading. β-Globin signals were quantified and corrected for the number of labeled uridines, for the relative sizes of the nuclear and cytoplasmic compartments, and for equal loading by using β-actin signals. Nuclear spliced (NS) and unspliced (_N_US) and cytoplasmic (C) transcripts were plotted as a function of time. Note that the y axis is on a logarithmic scale.
FIG. 5.
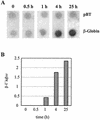
Transcriptional induction of β-globin by doxycycline. (A) Nuclear run-on transcription assay. HeLa-β-glo cells were treated with 2 μg of doxycycline/ml for the indicated periods of time. Nuclei were used for in vitro run-on transcription, and the product of the reaction was hybridized to β-globin and the Bluescript plasmid (pBT) DNA. (B) Quantification of the run-on experiment. β-Globin signals were quantified, corrected for background and relative hybridization efficiency using pBT signals, and plotted as a function of time.
FIG. 6.
β-Globin processing pathway. _N_US, primary transcript; N_US_i, partially spliced transcript retaining intron i; NS and C, nuclear and cytoplasmic mature mRNAs, respectively; k_S_i, splicing rate of intron i; kT and kD, transport and degradation rates, respectively.
FIG. 7.
Determination of β-globin splicing and transport rates during a short-term induction by using a polynomial description. (A) Intron 1 splicing rate and transport rate. HeLa-β-glo cells were treated with 2 μg of doxycycline/ml for up to 4 h. β-Globin transcripts were analyzed by RNase protection assay with the probe encompassing intron 1, as in Fig. 4. Nuclear spliced (NS) and unspliced (_N_US) and cytoplasmic (C) transcripts were plotted as a function of time. Curve-fitting functions, linear for NS and _N_US and binomial for C, were applied to the data. The best fits (lines) are displayed, the first term of the equation being indicated above. The correlation coefficients of the binomial fittings are indicated in Materials and Methods. (B) Intron 2 splicing rate and transport rate. The same samples were analyzed by RNase protection assay with a β-globin probe encompassing intron 2. The principle of the protection by spliced and unspliced transcripts is shown schematically at the top. Migration of the protected fragments is indicated at the right of the gel. ∗, migration expected for released linear intron 2. The experimental results and their fit by linear and binomial curves were plotted as for panel A. (C) Combined quantification of all the nuclear and cytoplasmic β-globin transcripts. The ratio between intron 2 unspliced and spliced RNA measured in panel B was used to calculate their participation to intron 1 unspliced and spliced RNA in panel A. These data and their curve fits were plotted as in panel A. The structure of all RNA species is shown on the right.
FIG. 8.
Determination of β-globin splicing and transport rates by computer simulation. (A) Experimental data. HeLa-β-glo cells were treated with 2 μg of doxycycline/ml for up to 24 h. β-Globin transcripts were analyzed by RNase protection assay with a probe encompassing intron 1, as in Fig. 4. Nuclear spliced (NS) and unspliced (_N_US) and cytoplasmic (C) transcripts were plotted as a function of time. Note that the y axis is on a logarithmic scale. (B) Computer simulation for the determination of intron 1 splicing rate. As in Fig. 2, the accumulation of spliced products was calculated by taking into account the experimental pool of _N_US precursors and varying the splicing rate. Only the best fit is presented. Note that the y axis is on a linear scale. (C) Computer simulation for the determination of the transport rate. As in Fig. 2, the accumulation of cytoplasmic mRNA was calculated by taking into account the experimental pool of NS precursors and varying the transport rate. Two examples fitting either the early or the late time point are presented. Note that the y axis is on a linear scale.
FIG. 9.
Effects of cell density and cytochalasin B (CCB) on β-globin splicing and transport rates. (A) Kinetics of accumulation of β-globin transcripts at different cell densities. HeLa-β-glo cells plated at various cell densities were treated with 2 μg of doxycycline/ml for up to 4 h. The amounts of RNA extracted per culture dish were 60, 110, and 130 μg for experiments 2, 3, and 4, respectively, corresponding to approximate levels of confluence of 45, 80, and 100%. β-Globin transcripts were analyzed by RNase protection assay with the β-globin probe encompassing intron 1, as in Fig. 7A. (B) Transport and splicing half-lives as a function of cell density. Intron 1 splicing and transport rates were calculated from data presented in Fig. 7A (experiment 1) and Fig. 9A (experiments 2, 3, and 4), as detailed in Results. The corresponding splicing and transport half-lives were plotted. (C) Kinetics of accumulation of β-globin transcripts following treatment with CCB. After a 1-h incubation with 2 μg of CCB/ml, HeLa-β-glo cells were treated with 2 μg of doxycycline/ml in the presence of CCB for up to 4 h. The amounts of RNA extracted per culture dish were 40 and 115 μg for experiments CCB1 and CCB2, respectively. β-Globin transcripts were analyzed as for panel A. (D) Transport and splicing half-lives after treatment with CCB. Splicing and transport half-lives were calculated and plotted as for panel B.
Similar articles
- Mature mRNAs accumulated in the nucleus are neither the molecules in transit to the cytoplasm nor constitute a stockpile for gene expression.
Weil D, Boutain S, Audibert A, Dautry F. Weil D, et al. RNA. 2000 Jul;6(7):962-75. doi: 10.1017/s1355838200000479. RNA. 2000. PMID: 10917593 Free PMC article. - Nucleocytoplasmic transport of fluorescent mRNA in living mammalian cells: nuclear mRNA export is coupled to ongoing gene transcription.
Tokunaga K, Shibuya T, Ishihama Y, Tadakuma H, Ide M, Yoshida M, Funatsu T, Ohshima Y, Tani T. Tokunaga K, et al. Genes Cells. 2006 Mar;11(3):305-17. doi: 10.1111/j.1365-2443.2006.00936.x. Genes Cells. 2006. PMID: 16483318 - Regulation of pre-mRNA processing by src.
Neel H, Gondran P, Weil D, Dautry F. Neel H, et al. Curr Biol. 1995 Apr 1;5(4):413-22. doi: 10.1016/s0960-9822(95)00082-0. Curr Biol. 1995. PMID: 7627556 - Coupling transcription, splicing and mRNA export.
Reed R. Reed R. Curr Opin Cell Biol. 2003 Jun;15(3):326-31. doi: 10.1016/s0955-0674(03)00048-6. Curr Opin Cell Biol. 2003. PMID: 12787775 Review. - A conserved mRNA export machinery coupled to pre-mRNA splicing.
Reed R, Hurt E. Reed R, et al. Cell. 2002 Feb 22;108(4):523-31. doi: 10.1016/s0092-8674(02)00627-x. Cell. 2002. PMID: 11909523 Review.
Cited by
- Frame-disrupting mutations elicit pre-mRNA accumulation independently of frame disruption.
Imam JS, Gudikote JP, Chan WK, Wilkinson MF. Imam JS, et al. Nucleic Acids Res. 2010 Mar;38(5):1559-74. doi: 10.1093/nar/gkp1115. Epub 2009 Dec 9. Nucleic Acids Res. 2010. PMID: 20007599 Free PMC article. - Linking splicing to Pol II transcription stabilizes pre-mRNAs and influences splicing patterns.
Hicks MJ, Yang CR, Kotlajich MV, Hertel KJ. Hicks MJ, et al. PLoS Biol. 2006 Jun;4(6):e147. doi: 10.1371/journal.pbio.0040147. Epub 2006 May 2. PLoS Biol. 2006. PMID: 16640457 Free PMC article. - Heat shock-independent induction of multidrug resistance by heat shock factor 1.
Tchénio T, Havard M, Martinez LA, Dautry F. Tchénio T, et al. Mol Cell Biol. 2006 Jan;26(2):580-91. doi: 10.1128/MCB.26.2.580-591.2006. Mol Cell Biol. 2006. PMID: 16382149 Free PMC article. - Splicing of human immunodeficiency virus RNA is position-dependent suggesting sequential removal of introns from the 5' end.
Bohne J, Wodrich H, Kräusslich HG. Bohne J, et al. Nucleic Acids Res. 2005 Feb 8;33(3):825-37. doi: 10.1093/nar/gki185. Print 2005. Nucleic Acids Res. 2005. PMID: 15701754 Free PMC article. - Fast synchronization of ultradian oscillators controlled by delta-notch signaling with cis-inhibition.
Tiedemann HB, Schneltzer E, Zeiser S, Wurst W, Beckers J, Przemeck GK, Hrabě de Angelis M. Tiedemann HB, et al. PLoS Comput Biol. 2014 Oct 2;10(10):e1003843. doi: 10.1371/journal.pcbi.1003843. eCollection 2014 Oct. PLoS Comput Biol. 2014. PMID: 25275459 Free PMC article.
References
- Bastos, R. N., and H. Aviv. 1977. Globin RNA precursor molecules: biosynthesis and process in erythroid cells. Cell 11:641-650. - PubMed
- Berger, S. L., and A. L. Kimmel. 1987. Guide to molecular cloning techniques. Methods Enzymol. 152:224-226. - PubMed
- Beyer, A. L., and Y. N. Osheim. 1988. Splice site selection, rate of splicing, and alternative splicing on nascent transcripts. Genes Dev. 2:754-765. - PubMed
- Biamonti, G., M. T. Bassi, L. Cartegni, F. Mechta, M. Buvoli, F. Cobianchi, and S. Riva. 1993. Human hnRNP protein A1 gene expression. Structural and functional characterization of the promoter. J. Mol. Biol. 230:77-89. - PubMed
Publication types
MeSH terms
Substances
LinkOut - more resources
Full Text Sources
Other Literature Sources
