Somatotopic activation in the human trigeminal pain pathway - PubMed (original) (raw)
Clinical Trial
Somatotopic activation in the human trigeminal pain pathway
Alex F M DaSilva et al. J Neurosci. 2002.
Abstract
Functional magnetic resonance imaging was used to image pain-associated activity in three levels of the neuraxis: the medullary dorsal horn, thalamus, and primary somatosensory cortex. In nine subjects, noxious thermal stimuli (46 degrees C) were applied to the facial skin at sites within the three divisions of the trigeminal nerve (V1, V2, and V3) and also to the ipsilateral thumb. Anatomical and functional data were acquired to capture activation across the spinothalamocortical pathway in each individual. Significant activation was observed in the ipsilateral spinal trigeminal nucleus within the medulla and lower pons in response to at least one of the three facial stimuli in all applicable data sets. Activation from the three facial stimulation sites exhibited a somatotopic organization along the longitudinal (rostrocaudal) axis of the brain stem that was consistent with the classically described "onion skin" pattern of sensory deficits observed in patients after trigeminal tractotomy. In the thalamus, activation was observed in the contralateral side involving the ventroposteromedial and dorsomedial nuclei after stimulation of the face and in the ventroposterolateral and dorsomedial nuclei after stimulation of the thumb. Activation in the primary somatosensory cortex displayed a laminar sequence that resembled the trigeminal nucleus, with V2 more rostral, V1 caudal, and V3 medial, abutting the region of cortical activation observed for the thumb. These results represent the first simultaneous imaging of pain-associated activation at three levels of the neuraxis in individual subjects. This approach will be useful for exploring central correlates of plasticity in models of experimental and clinical pain.
Figures
Fig. 1.
Experimental paradigm. A, Facial map. White squares denote location of the Peltier probe on the face. The three shades of _gray_differentiate the regions innervated by the V1 (ophthalmic;light gray), V2 (maxillary; medium gray), and V3 (mandibular; dark gray) divisions of the trigeminal nerve. B, Stimulus paradigm. After the anatomical scan, the Peltier thermode was applied to the target area within the V1 distribution, and two 25 sec pulses of 46°C were given 30 sec apart with a baseline temperature of 32°C. After a 3 min interval, the stimuli were repeated with the probe in the V2 target region. The same procedure was used for the V3 region and finally for the palmar surface of the right thumb (T). After each set of stimuli, subjects rated their pain scores (R, visual analog rating of pain level from 0 = no pain to 10 = maximum pain imaginable). The time line for stimulus duration and interstimulus interval at each site is indicated within the box. C, Slice orientation. Shown is the orientation through the midsagittal section of the whole brain used for these experiments. Slices (n = 30) were oriented parallel to the brainstem. The circles show the location of the spV and thalamus and the approximate location of the SI (projected from its lateral location).
Fig. 2.
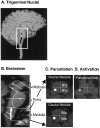
Brainstem parcellation. A, Trigeminal nuclei. Shown is the approximate distribution of the trigeminal sensory complex in the dorsal part of the brainstem.Gray, Mesencephalic nucleus; white, main sensory nucleus; black, spinal trigeminal nuclei (oralis, interpolaris, and caudalis). B, Parcellation of the brainstem in a sagittal section. To localize functional activation within the trigeminal nuclei using MRI, we followed a landmark-based topographical approach (for details, see Materials and Methods). Each_line_ is defined on MRI-based anatomy that is easily visualized. To this end, the human brainstem has been parcellated into 28 distinct PUs (14 PUs per side) in the midbrain, pons, and medulla.C, Parcellation of the medulla. A horizontal section through the rostral and caudal medulla is shown. The medulla has been subdivided into four PUs [rostral-anterior (B1a), rostral-posterior (B1p), caudal-anterior (B2a), caudal-posterior (B2p)]. See Materials and Methods for details of the parcellation method. Within the medulla, the spinal nucleus of V is found in the_B1p_ and B2p posterior components (white circles). D, Activation map. Shown is a statistical map of activation within the B1p segment of the right rostral medulla after a noxious thermal stimulus to the face. Note that this is the region where the spV is predicted (white circle in C).
Fig. 3.
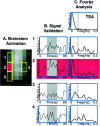
Signal analysis in the brainstem.A, Activation map in the brainstem. Shown is the activation map within the brainstem after the 46°C stimulus. The area indicated in red (2) is the activated zone, and the panels above (1), below (3), and opposite (4) the area activated (2) are also shown.B, Signal validation. The gray region in all the time course graphs indicates the 46°C stimulus duration. The panels show time courses of signal change within a three-voxel region, which matches the thermal stimulus temporally. The time courses for activity within brainstem regions of equal volume superior (1), inferior (2), and contralateral (3) to the activated zone (4) are shown. Percent signal change is shown in arbitrary units (a.u.). C, Fourier analysis. Shown is Fourier analysis for the thermal signal itself (TSA; top panel) and for the adjacent and contralateral signal changes shown in A for brainstem sites 1–4. The Fourier analyses indicate that other frequency changes are present, which may be respiratory or cardiac. Note, however, that contributions to the signal are present but not significant in the voxels above and below the activation.
Fig. 4.
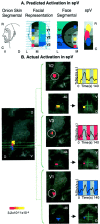
Activation in the spV. A, Predicted activation within the spV. Shown is the specificity of activation in the spV after noxious thermal stimulation to V1, V2, and V3 regions of the face based on the onion skin segmental divisions of the head (first panel) and the sensory innervation of the left side of the face with V1, V2, and V3 distributions depicted in different shades of blue (second panel). In the latter panel, the face is divided into 1.6 × 1.6 cm squares (the size of the thermal probe), with_color squares_ indicating the location of experimental stimulation sites for V1 (blue), V2 (yellow), and V3 (red). In addition, the rostrocaudal distribution of the concentric segmental arrangement of innervation is shown in gray. These are seen in a hemisection of the face in the third panel. On the basis of the location of the stimulation sites and the segmental divisions, activation within the trigeminal nucleus is predicted (fourth panel). Note that the three stimulation sites involve different segments in the rostrocaudal extent as well as three different divisions of the trigeminal nerve. R, Rostral; C, caudal; L, lateral;M, medial; V, ventral; D, dorsal. B, Actual activations in the spV. Shown is group average activation in spV after thermal stimulation to V1, V2, and V3 divisions of the trigeminal nerve. The leftmost panel is an overlay of statistical maps of averaged data from seven healthy subjects after 46°C stimulation with a 1.6 × 1.6 cm Peltier thermode to V1, V2, and V3 of the face. Note that these are actual data, but that the regions of activation are_color-coded_ for each area stimulated (p < 0.005). The center panels show statistical maps of activation in the sagittal and horizontal planes in the Talairach domain. The use of parcellation methods allows for definition of activation within a region of the brainstem correlating with the location of the trigeminal nucleus. Time courses for each group are also shown (right panels). The color code for each corresponds with the overlap map of activations within the nucleus. V, Ventral;D, dorsal; numbers in the top right corners indicate coordinates in the mediolateral axis (left panel) or in the rostrocaudal (z) axis.
Fig. 5.
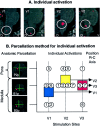
Individual analysis in the spV. A, Activation maps from single subjects. Shown are activation foci from two individuals mapped onto anatomical sagittal sections through the brainstem after a thermal stimulus to V1 or V2. D, Dorsal; V, ventral. B, Individual activations based on the parcellation method of the brainstem.Left panel, The parcellation for the pons and medulla is shown on the left. The red circles_represent the expected areas containing the spV in P2p(caudal pons), B1p (rostral medulla), and_B2p (caudal medulla). Right panel, Individual activations after stimulation to facial sites V1, V2, and V3 were localized according to the brainstem level using the parcellation method shown in the left panel. The mean frequency of activations, plotted as squares, shows the same rostrocaudal (R-C) somatotopy as for group average activations using a different approach as shown in Figure4_B_. Blue square, V1; yellow square, V2; red square, V3.
Fig. 6.
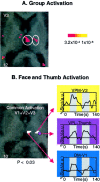
Activation in the thalamus. A, Group activation. Activation in the contralateral thalamus is shown after a noxious thermal stimulus to the V3 region of the face.B, Face and thumb activation. Activation is shown in the contralateral thalamus after stimulation to the face and hand. The_white areas_ show regions of common activation after thermal stimulation to the V1, V2, and V3 distributions of the face in regions defined as the DM and VPM nuclei. Activation of the thumb is mapped onto the same anatomical section (purple circle) and corresponds to the VPL nucleus. The regions are defined anatomically using the atlas of Talairach and Tournoux (1988). Time courses of activation for each area are shown in the_insets_. Percent signal change is shown in arbitrary units (a.u.); numbers in the_bottom corners_ indicate the Talairach coordinates in the rostrocaudal (z) axis.
Fig. 7.
Activation in S1. A, Facial representation (see legend to Fig. 4_A_,second panel). B, Face, segmental (see legend to Fig. 4_A_, third panel). C, S1 cortex. Shown is the expected activation patterns in a schematic of the S1 cortex based on the segmental nature of the face and the specific sites stimulated (shown in B). D, Cortical activation maps. Shown is activation in the contralateral somatosensory cortex after 46°C stimulus to the right V1, V2, and V3 divisions of the trigeminal nerve (A) and right thumb in seven subjects. Activations are shown as statistical maps of the contralateral cortex, color-coded to match the stimulation sites for each region in C.C, Composite of activations. P, Posterior; A, anterior; numbers in the_bottom corners_ indicate the Talairach coordinate in the mediolateral (x) axis.
Similar articles
- Representation of different trigeminal divisions within the primary and secondary human somatosensory cortex.
Iannetti GD, Porro CA, Pantano P, Romanelli PL, Galeotti F, Cruccu G. Iannetti GD, et al. Neuroimage. 2003 Jul;19(3):906-12. doi: 10.1016/s1053-8119(03)00139-3. Neuroimage. 2003. PMID: 12880819 Clinical Trial. - Organization of peripheral and central pain pathways.
Bloedel JR, McCreery DB. Bloedel JR, et al. Surg Neurol. 1975 Jul;4(1):65-81. Surg Neurol. 1975. PMID: 170695 Review. - [Neurobiology of trigeminal pain].
Dallel R, Villanueva L, Woda A, Voisin D. Dallel R, et al. Med Sci (Paris). 2003 May;19(5):567-74. doi: 10.1051/medsci/2003195567. Med Sci (Paris). 2003. PMID: 12836390 Review. French.
Cited by
- Capsaicin-induced thermal hyperalgesia and sensitization in the human trigeminal nociceptive pathway: an fMRI study.
Moulton EA, Pendse G, Morris S, Strassman A, Aiello-Lammens M, Becerra L, Borsook D. Moulton EA, et al. Neuroimage. 2007 May 1;35(4):1586-600. doi: 10.1016/j.neuroimage.2007.02.001. Epub 2007 Feb 13. Neuroimage. 2007. PMID: 17407825 Free PMC article. - Aura Mapping: Where Vision and Somatosensation Meet.
Wilkinson F. Wilkinson F. Vision (Basel). 2021 Oct 30;5(4):52. doi: 10.3390/vision5040052. Vision (Basel). 2021. PMID: 34842832 Free PMC article. - Capsaicin-induced secondary hyperalgesia differences between the trigeminal and spinal innervation.
Novaes IC, Ardestani SS, Nascimento AMS, Conti PCR, Bonjardim LR, Svensson P, Exposto FG, Costa YM. Novaes IC, et al. Sci Rep. 2025 Jan 2;15(1):308. doi: 10.1038/s41598-024-83312-8. Sci Rep. 2025. PMID: 39747887 Free PMC article. Clinical Trial. - Noninvasive mapping of human trigeminal brainstem pathways.
Upadhyay J, Knudsen J, Anderson J, Becerra L, Borsook D. Upadhyay J, et al. Magn Reson Med. 2008 Nov;60(5):1037-46. doi: 10.1002/mrm.21682. Magn Reson Med. 2008. PMID: 18956455 Free PMC article. - Area-specific representation of mechanical nociceptive stimuli within SI cortex of squirrel monkeys.
Chen LM, Friedman RM, Roe AW. Chen LM, et al. Pain. 2009 Feb;141(3):258-268. doi: 10.1016/j.pain.2008.11.018. Epub 2009 Jan 10. Pain. 2009. PMID: 19136211 Free PMC article.
References
- Afshar F, Dykes E. Computer-generated three-dimensional visualization of the trigeminal nuclear complex. Surg Neurol. 1984;22:189–196. - PubMed
- Apkarian AV, Gelnar PA, Krauss BR, Szeverenyi NM. Cortical responses to thermal pain depend on stimulus size: a functional MRI study. J Neurophysiol. 2000a;83:3113–3122. - PubMed
- Apkarian AV, Shi T, Bruggemann J, Airapetian LR. Segregation of nociceptive and non-nociceptive networks in the squirrel monkey somatosensory thalamus. J Neurophysiol. 2000b;84:484–494. - PubMed
- Becerra LR, Breiter HC, Stojanovic M, Fishman S, Edwards A, Comite AR, Gonzalez RG, Borsook D. Human brain activation under controlled thermal stimulation and habituation to noxious heat: an fMRI study. Magn Reson Med. 1999;41:1044–1057. - PubMed
- Becerra L, Breiter HC, Wise R, Gonzalez RG, Borsook D. Reward circuitry activation by noxious thermal stimuli. Neuron. 2001;32:927–946. - PubMed
Publication types
MeSH terms
LinkOut - more resources
Full Text Sources
Medical

