ENSO and cholera: a nonstationary link related to climate change? - PubMed (original) (raw)
ENSO and cholera: a nonstationary link related to climate change?
Xavier Rodo et al. Proc Natl Acad Sci U S A. 2002.
Abstract
We present here quantitative evidence for an increased role of interannual climate variability on the temporal dynamics of an infectious disease. The evidence is based on time-series analyses of the relationship between El Niño/Southern Oscillation (ENSO) and cholera prevalence in Bangladesh (formerly Bengal) during two different time periods. A strong and consistent signature of ENSO is apparent in the last two decades (1980-2001), while it is weaker and eventually uncorrelated during the first parts of the last century (1893-1920 and 1920-1940, respectively). Concomitant with these changes, the Southern Oscillation Index (SOI) undergoes shifts in its frequency spectrum. These changes include an intensification of the approximately 4-yr cycle during the recent interval as a response to the well documented Pacific basin regime shift of 1976. This change in remote ENSO modulation alone can only partially serve to substantiate the differences observed in cholera. Regional or basin-wide changes possibly linked to global warming must be invoked that seem to facilitate ENSO transmission. For the recent cholera series and during specific time intervals corresponding to local maxima in ENSO, this climate phenomenon accounts for over 70% of disease variance. This strong association is discontinuous in time and can only be captured with a technique designed to isolate transient couplings.
Figures
Figure 1
(Upper) Standardized SOI series for the past (1893–1940) and present (1980–2001) periods. Values between 1940 and 1980 are not shown in accordance with the period with no cholera data. (Lower) Total cholera deaths (mortality) in Dhaka (Bangladesh) for the historical period 1893–1940, and percentage of cholera cases (cholera morbidity) in the same region for the present period (1980–2001). Scale at left is in mortality per 1,000 individuals and scale at right refers to percentages (see Methods and Data).
Figure 2
Reconstructions of the first cluster of eigenvalues detected by SSA (refs. and , and Appendix) of the cholera and SOI series in Fig. 1. The reconstruction of principal components (PCs) 1 to 4 for cholera is plotted in black, whereas that of PCs 1 to 4 for SOI is shown in gray. In all cases, a window length of 60 months was used for the reconstructions to capture periods of ≈2 and 4 yr (the quasibiennial and quasiquadrennial components, respectively) in both ENSO and cholera.
Figure 3
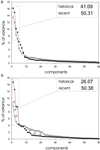
Variance spectra for the series in Fig. 1. (a) SOI. (b) Cholera. White and black squares refer to past and present intervals, respectively. The relative variance accounted for by the four reconstructed components of Fig. 2 is shown separately for the historical and present periods in Inset. Gray arrows in b indicate the changes occurring in the different portions of the spectra. For all analyses, a window length of 60 months was selected to be able to isolate the typical temporal scales of El Niño.
Figure 4
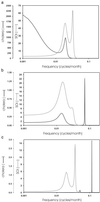
Frequency spectra computed for the reconstructed time series of cholera and SOI of Fig. 2, for the present (a) and past divided into two periods, 1893–1920 (b) and 1920–1940 (c). The frequency spectra were obtained with the MEM. During the last 2 decades, a quasiquadrennial cycle is present for both ENSO and cholera which closely matches in frequency (a). This correspondence is also seen for the first part of the historical record (b: main period at 6.5 yr) but disappears with no clear dominant frequency in the interannual variability of cholera in the later part (c). The spectrum of SOI for the present shows a more important contribution of the 4–5 yr range. This part of the spectrum weakens around 1920 (c). (For consistency, results were crosschecked with those from the multitaper method spectrum analysis).
Figure 5
Results of the SDC analysis (14) for both the historical or past period (a) and the present interval (b and c). SDC analysis computes all possible correlations between fragments of a given size for all locations in the two series. Several window sizes were inspected in intermediate plots (not shown) for each analysis, namely S = 200, S = 100, and S = 25. The window S = 25 was chosen as a scale that produces the highest local correlations. This fragment size appears as a black bar in the top-left corner of each graph. Significant correlations are represented by points anchored in the central value of the fragment size (S) that has been used to calculate correlations. In this figure, the ENSO time series (SOI or Niño 3.4) is used as the reference data set to display the location of significant correlations. The colors of the dots correspond to different time lags for the location of the respective fragment in the cholera data set, with cholera lagging SOI in b or Niño 3.4 in c. Significance levels are P < 0.01 for all points in the graph, and P < 0.00001 for the overall SDC pattern (14). Boxes refer to strong–very strong El Niño (dark boxes), strong–very strong La Niña (light-gray boxes), and moderate ENSO episodes (white boxes). Episodes were classified according to standardized terminology, both for the historical ENSO period (39) and for the recent interval (40). The analysis identifies isolated episodes of covariation and quantifies the corresponding local contribution to the overall variance. Local correlations in the four EN episodes attain values up to a maximum of r(−8 months)xy = 0.84 (P < 0.0001) in the EN of 1991. The highest values for the La Niña of 1988 are r(−11 months)xy = 0.86 (P < 0.0001). Thus, ENSO accounts for over 70% of total variability in the recent cholera series during transient intervals of association. These intervals overlap with the timing of the highest cholera cases. Outside these intervals, the two dynamics decouple, with correlation values close to zero. Comparison among results obtained with both SOI and Niño 3.4 indicate the superior utility of oceanic conditions in the tropical Pacific as remote predictors for cholera (c). Values attained are slightly higher for Niño 3.4, and the clusters associated to each episode are formed by many more correlations than when calculated with the SOI. Because of the quality of historical SST records in the Niño region, only sea-level pressures (or SOI) were considered for that period. Correlations with Niño 3.4 are able to capture peaks in cholera for the complex 1991–1994 episode, an episode otherwise insensitive to SOI analyses. An ENSO signature clearly dominates the recent cholera series, whereas it is more inconsistent and then largely absent from first and second parts of the historical record, respectively. (See Appendix and ref. for further details on the method).
Comment in
- A human disease indicator for the effects of recent global climate change.
Patz JA. Patz JA. Proc Natl Acad Sci U S A. 2002 Oct 1;99(20):12506-8. doi: 10.1073/pnas.212467899. Epub 2002 Sep 23. Proc Natl Acad Sci U S A. 2002. PMID: 12271143 Free PMC article. No abstract available.
Similar articles
- Cholera dynamics and El Niño-Southern Oscillation.
Pascual M, Rodó X, Ellner SP, Colwell R, Bouma MJ. Pascual M, et al. Science. 2000 Sep 8;289(5485):1766-9. doi: 10.1126/science.289.5485.1766. Science. 2000. PMID: 10976073 - The changing relationship between Cholera and interannual climate variables in Kolkata over the past century.
Shackleton D, Memon FA, Chen A, Dutta S, Kanungo S, Deb A. Shackleton D, et al. Gut Pathog. 2023 Sep 13;15(1):42. doi: 10.1186/s13099-023-00565-w. Gut Pathog. 2023. PMID: 37704999 Free PMC article. - El Niño and the shifting geography of cholera in Africa.
Moore SM, Azman AS, Zaitchik BF, Mintz ED, Brunkard J, Legros D, Hill A, McKay H, Luquero FJ, Olson D, Lessler J. Moore SM, et al. Proc Natl Acad Sci U S A. 2017 Apr 25;114(17):4436-4441. doi: 10.1073/pnas.1617218114. Epub 2017 Apr 10. Proc Natl Acad Sci U S A. 2017. PMID: 28396423 Free PMC article. - El Niño and health.
Kovats RS, Bouma MJ, Hajat S, Worrall E, Haines A. Kovats RS, et al. Lancet. 2003 Nov 1;362(9394):1481-9. doi: 10.1016/S0140-6736(03)14695-8. Lancet. 2003. PMID: 14602445 Review. - Global climate and infectious disease: the cholera paradigm.
Colwell RR. Colwell RR. Science. 1996 Dec 20;274(5295):2025-31. doi: 10.1126/science.274.5295.2025. Science. 1996. PMID: 8953025 Review.
Cited by
- The Impact of Climate Change on Vaccine-Preventable Diseases: Insights From Current Research and New Directions.
Mahmud AS, Martinez PP, He J, Baker RE. Mahmud AS, et al. Curr Environ Health Rep. 2020 Dec;7(4):384-391. doi: 10.1007/s40572-020-00293-2. Epub 2020 Oct 25. Curr Environ Health Rep. 2020. PMID: 33099754 Free PMC article. Review. - Thermal stress and coral cover as drivers of coral disease outbreaks.
Bruno JF, Selig ER, Casey KS, Page CA, Willis BL, Harvell CD, Sweatman H, Melendy AM. Bruno JF, et al. PLoS Biol. 2007 Jun;5(6):e124. doi: 10.1371/journal.pbio.0050124. PLoS Biol. 2007. PMID: 17488183 Free PMC article. - Epidemic cholera spreads like wildfire.
Roy M, Zinck RD, Bouma MJ, Pascual M. Roy M, et al. Sci Rep. 2014 Jan 15;4:3710. doi: 10.1038/srep03710. Sci Rep. 2014. PMID: 24424273 Free PMC article. - Challenges in developing methods for quantifying the effects of weather and climate on water-associated diseases: A systematic review.
Lo Iacono G, Armstrong B, Fleming LE, Elson R, Kovats S, Vardoulakis S, Nichols GL. Lo Iacono G, et al. PLoS Negl Trop Dis. 2017 Jun 12;11(6):e0005659. doi: 10.1371/journal.pntd.0005659. eCollection 2017 Jun. PLoS Negl Trop Dis. 2017. PMID: 28604791 Free PMC article. - Small RNAs as Fundamental Players in the Transference of Information During Bacterial Infectious Diseases.
González Plaza JJ. González Plaza JJ. Front Mol Biosci. 2020 Jun 16;7:101. doi: 10.3389/fmolb.2020.00101. eCollection 2020. Front Mol Biosci. 2020. PMID: 32613006 Free PMC article. Review.
References
- Watson R T, Zinyowera M C, Moss R H. IPCC Special Report on The Regional Impacts of Climate Change: An Assessment of Vulnerability. Cambridge, U.K.: Cambridge Univ. Press; 1998.
- Huq S S. Science. 2001;294:1617. - PubMed
- Colwell R R. Science. 1996;274:2025–2031. - PubMed
- World Health Organization. Regional Health Report 1996. Geneva: W.H.O.; 1996.
Publication types
MeSH terms
LinkOut - more resources
Full Text Sources
Medical


