Modulation of T-lymphocyte development, growth and cell size by the Myc antagonist and transcriptional repressor Mad1 - PubMed (original) (raw)
Modulation of T-lymphocyte development, growth and cell size by the Myc antagonist and transcriptional repressor Mad1
Brian M Iritani et al. EMBO J. 2002.
Abstract
Activated lymphocytes must increase in size and duplicate their contents (cell growth) before they can divide. The molecular events that control cell growth in proliferating lymphocytes and other metazoan cells are still unclear. Here, we utilized transgenesis to provide evidence suggesting that the basic helix-loop- helix-zipper (bHLHZ) transcriptional repressor Mad1, considered to be an antagonist of Myc function, inhibits lymphocyte expansion, maturation and growth following pre-T-cell receptor (pre-TCR) and TCR stimulation. Furthermore, we utilized cDNA microarray technology to determine that, of the genes repressed by Mad1, the majority (77%) are involved in cell growth, which correlates with a decrease in size of Mad1 transgenic thymocytes. Over 80% of the genes repressed by Mad1 have previously been found to be induced by Myc. These results suggest that a balance between Myc and Mad levels may normally modulate lymphocyte proliferation and development in part by controlling expression of growth-regulating genes.
Figures
Fig. 1. Expression of Mad1 in immature T- and B-lineage cells utilizing the lck proximal promoter and Ig heavy chain enhancer. (A) The Mad1 transcriptional element includes a 3.2 kb fragment of the mouse lck gene that contains the proximal promoter to +37 with respect to the transcriptional start site, a 0.92 kb fragment of the intronic heavy chain enhancer and a 2.1 kb mutated non-translatable version of the human growth hormone gene. The murine mad1 cDNA was inserted into the _Bam_HI site. (B) The Eµ-_lck_-mad1 construct drives expression of murine Mad1 protein in thymocytes, B-cell progenitors, and weakly in splenocytes. The figure shows an immunoblot of whole-cell lysate from 5 × 10⁶ bone marrow cells (Bm), splenocytes (Sp) and thymocytes (Th) from non-Tg littermate control mice (LMC) and Eµ-_lck_-mad1 Tg mice. Protein-containing samples were separated using 12% SDS–PAGE, transferred to nitrocellulose and visualized using a murine Mad1-specific antibody (C19). As a loading control, we used antibodies against the highly stable Max protein (Blackwood et al., 1992).
Fig. 2. Mad1 overexpression results in decreased thymocyte cellularity and impaired T-lymphocyte development. (A) Total thymocytes were purified from 8- to 16-week-old Eµ-_lck_-mad1 Tg (4879 line) and normal littermate control mice. The mean and standard error of the total thymocyte cell number from six mice of each genotype are shown. (B) Total thymocyte cell number was multiplied by the percentage of total thymocytes that fall within each quadrant, as determined by flow cytometry using PE-conjugated anti-CD4 or FITC-conjugated anti-CD8. (C) Total thymocytes from Eµ-_lck_-mad1 Tg (4879 line and 4880 line) and control mice were stained as in (B). A representative flow cytometric histogram from 8-week-old mice is shown. (D) Total thymocytes were stained with biotinylated anti-B220, anti-GR-1, anti-Mac1, anti-CD4, anti-CD8, FITC-conjugated anti-CD25 and PE-conjugated anti-CD44, followed by streptavidin (SA)–tricolor. A representative flow cytometric histogram of gated tricolor-negative cells showing CD44–PE versus CD25–FITC fluorescence is shown. Eµ-_lck_-mad1 Tg mice are blocked at the CD44–CD25+ cell stage. (E) Total thymocytes were stained with biotinylated anti-CD3ε, followed by SA–tricolor. A representative single-color histogram showing CD3ε expression is shown.
Fig. 3. Expression of Mad1 inhibits pre-TCR-mediated development and expansion. (A) Eµ-_lck_-mad1 Tg mice were bred with RAG-2–/– mice to generate Mad1 Tg+/RAG-2–/– progeny. Four- to 8-week-old RAG-2–/– or Mad1+/RAG-2–/– mice were injected with 100 µg of anti-CD3ε (2C11) antibody intraperitoneally in 500 µl of sterile PBS. Thymocytes were harvested at the indicated time points and stained with anti-CD4–PE and anti-CD8–FITC. Representative flow cytometric histograms of cells that fall within a standard forward- and side-scatter lymphocyte gate are shown. A normal control mouse was included in each experiment (upper left panel) to set quadrants. The total cell number is shown in the upper right quadrant, for each time point. (B) RAG-2–/– or Mad1 Tg+/RAG-2–/– mice were injected with 100 µg of anti-CD3ε and thymocytes were harvested 1, 3 and 7 days post-injection and stained with propidium iodide. The percentage of total thymocytes that fall within G0/G1, S or G2 phases of the cell cycle at each time point following anti-CD3ε injection is shown. Sub-G1 cells represent apoptotic cells. (C) RAG-2–/– or Mad1 Tg+/RAG-2–/– mice were injected with 100 µg of anti-CD3ε and thymocytes were harvested 7 or 10 days post-injection. A total of 2 × 10⁶ thymocytes were lysed, boiled and sonicated in 2× sample buffer, and proteins separated on a 12% SDS gel. Proteins were then transferred to a nitrocellulose membrane and probed with anti-Mad1 (C19). An immunoblot indicating murine Mad1 expression at each time point post-anti-CD3ε injection is shown.
Fig. 4. Expression of cytoplasmic pre-TCR signaling molecules is not inhibited by Mad1. (A) A total of 2 × 10⁶ thymocytes from Eµ-_lck_-mad1 Tg or littermate control mice were lysed, boiled and sonicated in 2× sample buffer, and proteins separated on a 12% SDS gel. Protein were then visualized using anti-Mad1, anti-Bcl-2, anti-Lck antiserum and anti-ZAP70. Immunoblots generated using ECL are shown. (B) Total thymocytes from RAG-2–/– or Mad1 Tg+/RAG-2–/– mice were harvested and processed as in (A). Proteins were visualized using anti-Mad1, anti-LAT and anti-SLP-76, followed by ECL. (C) Total thymocytes from Eμ-_lck_-mad1 and normal littermate control mice were loaded with indole dye, and stained with anti-CD4–PE and anti-CD8–FITC. A two-dimensional flow cytometric histogram showing the violet to blue ratio (calcium) versus time of gated CD4–CD8– thymocytes following stimulation with ionomycin is shown.
Fig. 5. B- and T-cell proliferation is inhibited by Mad1. (A) Purified T or B lymphocytes were stimulated with either plate-bound 30, 15 or 5 µg/ml anti-CD3ε or 12, 6 or 3 µg/ml anti-IgM (Fab′)2, or LPS at 25 µg/ml for 96 h at 37°C. Cells were pulsed with [3H]thymidine for the last 18 h. A representative bar histogram is shown depicting the average incorporation of [3H]thymidine by Eµ-_lck_-mad1 Tg versus normal littermate control lymphocytes. (B) Purified T or B lymphocytes were labeled with CFSE dye for 10 min at 37°C. They were then stimulated with either plate-bound 30 µg/ml anti-CD3ε or 12 µg/ml anti-IgM (Fab′)2 for 24 or 48 h at 37°C, and analyzed by flow cytometry. The images are representative flow cytometric histograms showing log CFSE fluorescence for stimulated B or T lymphocytes from Eµ-_lck_-mad1 Tg (unfilled curve) versus normal littermate control mice (gray filled curve).
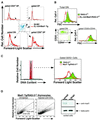
Fig. 6. Eµ-_lck_-mad1 transgenic thymocytes are smaller than littermate control cells throughout T-cell development. (A) Total thymocytes from Eµ-_lck_-mad1 Tg and normal littermate control mice were stained with FITC-conjugated anti-CD8 and PE-conjugated anti-CD4. Cells were initially gated on a forward- and side-scatter lymphocyte gate to exclude dead cells. The image is a representative flow cytometric histogram showing forward scatter of cells that fall within DN, DP, CD4+CD8– or CD8+CD4– gates. (B) Total thymocytes from Mad1+/RAG-2–/– mice were stained with biotinylated anti-B220, anti-GR-1, anti-Mac1, anti-CD4, anti-CD8, FITC-conjugated anti-CD25 and PE-conjugated anti-CD44, followed by SA–tricolor. The image is a representative flow cytometric histogram showing forward scatter of either total DN thymocytes or CD44–CD25+ DN (CD4–CD8–B220–Gr1–Mac1–) thymocytes. Mad1 Tg thymocytes are smaller than wild-type thymocytes. (C) Total thymocytes from mice were stained with propidium iodide. The image is a representative flow cytometric histogram showing the size of gated G0/G1 cells, as determined by forward light-scatter characteristics. (D) Mad1+/RAG-2–/– mice were injected with anti-CD3ε, and thymocytes harvested 48 h later. Large and small cells were sorted by FACS as shown, and 1 × 10⁶ cells were lysed, boiled and sonicated in 2× sample buffer, and proteins separated on a 12% SDS gel. Proteins were then transferred to a nitrocellulose membrane and probed with anti-Mad1 (C19) or anti-β-actin.
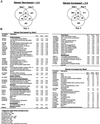
Fig. 7. Overexpression of Mad1 in primary thymocytes alters the expression of predominantly genes involved in controlling cellular growth. DN thymocytes from 6- to 9-week-old Mad1+/RAG2–/– or RAG2–/– mice (4–6 mice per condition) were purified and cRNA arrayed to Affymetrix mouse arrays containing 11 000 genes. (A) Venn diagrams of the number of genes altered in each of three independent experiments. The criteria for decreased gene expression (left) or increased expression (right) were as follows: (i) the ratio of the expression level in the Mad1+/RAG2–/– sample to that in the RAG2–/– sample was <0.5 (left) or >2 (right); (ii) the gene was called ‘present’ by Affymetrix software in the three Mad1+/RAG2–/– samples; and (iii) the difference was >2 SD from the mean. (B) The genes that meet the above criteria for increased or decreased expression in three independent Mad1+/RAG2–/– versus RAG2–/– experiments. An asterisk indicates genes that have previously been shown to be induced by c- or N-Myc in the indicated references (numbers).
Similar articles
- Co-induction of Mad1 and c-Myc in activated normal B lymphocytes.
Ertesvåg A, Blomhoff HK, Beiske K, Naderi S. Ertesvåg A, et al. Scand J Immunol. 2000 Jun;51(6):565-70. doi: 10.1046/j.1365-3083.2000.00726.x. Scand J Immunol. 2000. PMID: 10849366 - Mad1 expression in the absence of differentiation: effect of cAMP on the B-lymphoid cell line Reh.
Naderi S, Blomhoff HK. Naderi S, et al. J Cell Physiol. 1999 Jan;178(1):76-84. doi: 10.1002/(SICI)1097-4652(199901)178:1<76::AID-JCP10>3.0.CO;2-2. J Cell Physiol. 1999. PMID: 9886493 - Switch from Myc/Max to Mad1/Max binding and decrease in histone acetylation at the telomerase reverse transcriptase promoter during differentiation of HL60 cells.
Xu D, Popov N, Hou M, Wang Q, Björkholm M, Gruber A, Menkel AR, Henriksson M. Xu D, et al. Proc Natl Acad Sci U S A. 2001 Mar 27;98(7):3826-31. doi: 10.1073/pnas.071043198. Proc Natl Acad Sci U S A. 2001. PMID: 11274400 Free PMC article. - MAD1 and its life as a MYC antagonist: an update.
Lüscher B. Lüscher B. Eur J Cell Biol. 2012 Jun-Jul;91(6-7):506-14. doi: 10.1016/j.ejcb.2011.07.005. Epub 2011 Sep 13. Eur J Cell Biol. 2012. PMID: 21917351 Review. - The activities of MYC, MNT and the MAX-interactome in lymphocyte proliferation and oncogenesis.
Link JM, Hurlin PJ. Link JM, et al. Biochim Biophys Acta. 2015 May;1849(5):554-62. doi: 10.1016/j.bbagrm.2014.04.004. Epub 2014 Apr 13. Biochim Biophys Acta. 2015. PMID: 24731854 Review.
Cited by
- The Caenorhabditis elegans Myc-Mondo/Mad complexes integrate diverse longevity signals.
Johnson DW, Llop JR, Farrell SF, Yuan J, Stolzenburg LR, Samuelson AV. Johnson DW, et al. PLoS Genet. 2014 Apr 3;10(4):e1004278. doi: 10.1371/journal.pgen.1004278. eCollection 2014 Apr. PLoS Genet. 2014. PMID: 24699255 Free PMC article. - Ionizing Radiation Induces Morphological Changes and Immunological Modulation of Jurkat Cells.
Voos P, Fuck S, Weipert F, Babel L, Tandl D, Meckel T, Hehlgans S, Fournier C, Moroni A, Rödel F, Thiel G. Voos P, et al. Front Immunol. 2018 Apr 30;9:922. doi: 10.3389/fimmu.2018.00922. eCollection 2018. Front Immunol. 2018. PMID: 29760710 Free PMC article. - Interactions between Myc and MondoA transcription factors in metabolism and tumourigenesis.
Wilde BR, Ayer DE. Wilde BR, et al. Br J Cancer. 2015 Dec 1;113(11):1529-33. doi: 10.1038/bjc.2015.360. Epub 2015 Oct 15. Br J Cancer. 2015. PMID: 26469830 Free PMC article. Review. - In vivo quantitative analysis of anterior chamber white blood cell mixture composition using spectroscopic optical coherence tomography.
Qian R, McNabb RP, Zhou KC, Mousa HM, Saban DR, Perez VL, Kuo AN, Izatt JA. Qian R, et al. Biomed Opt Express. 2021 Mar 17;12(4):2134-2148. doi: 10.1364/BOE.419063. eCollection 2021 Apr 1. Biomed Opt Express. 2021. PMID: 33996220 Free PMC article. - Drosophila growth and development in the absence of dMyc and dMnt.
Pierce SB, Yost C, Anderson SA, Flynn EM, Delrow J, Eisenman RN. Pierce SB, et al. Dev Biol. 2008 Mar 15;315(2):303-16. doi: 10.1016/j.ydbio.2007.12.026. Epub 2007 Dec 27. Dev Biol. 2008. PMID: 18241851 Free PMC article.
References
- Aifantis I., Gounari,F., Scorrano,L., Borowski,C. and von Boehmer,H. (2001) Constitutive pre-TCR signaling promotes differentiation through Ca2+ mobilization and activation of NF-κB and NFAT. Nat. Immunol., 2, 403–409. - PubMed
- Appleby M.W., Gross,J.A., Cooke,M.P., Levin,S.D., Qian,X. and Perlmutter,R.M. (1992) Defective T cell receptor signaling in mice lacking the thymic isoform of p59fyn. Cell, 70, 751–763. - PubMed
Publication types
MeSH terms
Substances
LinkOut - more resources
Full Text Sources
Other Literature Sources
Molecular Biology Databases


