A kinetic study of beta-lactoglobulin amyloid fibril formation promoted by urea - PubMed (original) (raw)
A kinetic study of beta-lactoglobulin amyloid fibril formation promoted by urea
Daizo Hamada et al. Protein Sci. 2002 Oct.
Abstract
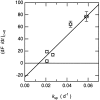
The formation of fibrillar aggregates by beta-lactoglobulin in the presence of urea has been monitored by using thioflavin T fluorescence and transmission electron microscopy (TEM). Large quantities of aggregated protein were formed by incubating beta-lactoglobulin in 3-5 M urea at 37 degrees C and pH 7.0 for 10-30 days. The TEM images of the aggregates in 3-5 M urea show the presence of fibrils with diameters of 8-10 nm, and increases in thioflavin T fluorescence are indicative of the formation of amyloid structures. The kinetics of spontaneous fibrillogenesis detected by thioflavin T fluorescence show sigmoidal behavior involving a clear lag phase. Moreover, addition of preformed fibrils into protein solutions containing urea shows that fibril formation can be accelerated by seeding processes that remove the lag phase. Both of these findings are indicative of nucleation-dependent fibril formation. The urea concentration where fibril formation is most rapid, both for seeded and unseeded solutions, is approximately 5.0 M, close to the concentration of urea corresponding to the midpoint of unfolding (5.3 M). This result indicates that efficient fibril formation involves a balance between the requirement of a significant population of unfolded or partially unfolded molecules and the need to avoid conditions that strongly destabilize intermolecular interactions.
Figures
Fig. 1.
Schematic representation of the native structure of bovine β-LG drawn using WebLab Viewer Lite, Molecular Simulations Inc. (San Diego, CA). The β-strands and α-helices are colored in cyan and red, respectively.
Fig. 2.
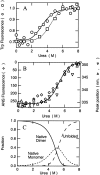
Urea-induced unfolding of β-LG at pH 7.0 and 37°C. (A) Data obtained by monitoring the fluorescence intensity at 343 nm in the presence of 0.05 (○) or 1.0 (□) mg/mL of β-LG. The ordinate is the relative value to the fluorescence of unfolded protein in 8.0 M urea. (B) Data obtained by monitoring the frequency shift of the fluorescence maximum in the presence of 0.05 (▵) and 1.0 () mg/mL of β-LG, and the fluorescence intensity of ANS (⋄) in the presence of 0.05 mg/mL of β-LG. (C) Fractions of native dimeric, native monomeric, and unfolded states as a function of urea concentration in the presence of 1 mg/mL of β-LG. The curves were drawn using the parameters shown in the text.
Fig. 3.
TEM images of aggregates formed by incubating β-LG for 30 days at 37°C in (A) 3.0, (B) 4.0, (C) 5.0 M urea at pH 7.0. The scale bars represent 100 nm.
Fig. 4.
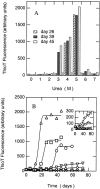
Increases in thioT fluorescence upon binding to aggregates of β-LG. (A) The fluorescence intensity of thioT versus urea concentration. (B) ThioT fluorescence at 0 (|aI|aU), 3 (○), 4 (□), 5 (▵), 6 () and 7 (⋄) M urea as a function of incubation time. Inset of B is the expansion to represent the data at 0, 6, and 7 M urea.
Fig. 5.
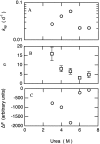
Kinetic parameters for spontaneous fibril formation by β-LG. The data were fitted to stretched exponential functions F = F_∞ + Δ_F exp (−[_k_sp • _t_]n). (A) Rate constant (k_sp) versus (urea). (B) Exponent (n) versus (urea). (C) Amplitude (Δ_F) versus (urea).
Fig. 6.
Rate constant of spontaneous fibril formation (k_sp) versus the final quantity of protein incorporated into fibrils (Δ_F). Experimental data are represented by circles. The line corresponds to the best fit of experimental data to a straight line.
Fig. 7.
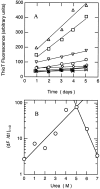
Seeding effects on fibril extension monitored by thioT fluorescence. (A) ThioT fluorescence intensity as a function of time. Data were obtained at 0 (▹◃), 1 (⊕), 2 (⊞), 3 (○), 4 (□), 5 (▵), 6 (), and 7 (⋄) M urea. (B) Initial rates of fibril extension (d_F_/d_t_)t = 0 in the seeding experiments, as described in the text, as a function of these urea concentrations.
Fig. 8.
Comparison of the rate of fibril formation for unseeded (k_sp) and seeded (d_F/d_t_)t = 0 solutions. Experimental data are represented by circles. The continuous line corresponds to the best fit of experimental data to a straight line.
Similar articles
- Macromolecular crowding modulates the kinetics and morphology of amyloid self-assembly by β-lactoglobulin.
Ma B, Xie J, Wei L, Li W. Ma B, et al. Int J Biol Macromol. 2013 Feb;53:82-7. doi: 10.1016/j.ijbiomac.2012.11.008. Epub 2012 Nov 10. Int J Biol Macromol. 2013. PMID: 23148946 - Re-formation of fibrils from hydrolysates of β-lactoglobulin fibrils during in vitro gastric digestion.
Bateman L, Ye A, Singh H. Bateman L, et al. J Agric Food Chem. 2011 Sep 14;59(17):9605-11. doi: 10.1021/jf2020057. Epub 2011 Aug 4. J Agric Food Chem. 2011. PMID: 21790203 - Lysozyme amyloidogenesis is accelerated by specific nicking and fragmentation but decelerated by intact protein binding and conversion.
Mishra R, Sörgjerd K, Nyström S, Nordigården A, Yu YC, Hammarström P. Mishra R, et al. J Mol Biol. 2007 Feb 23;366(3):1029-44. doi: 10.1016/j.jmb.2006.11.084. Epub 2006 Dec 2. J Mol Biol. 2007. PMID: 17196616 - In vitro oligomerization and fibrillogenesis of amyloid-beta peptides.
Benseny-Cases N, Klementieva O, Cladera J. Benseny-Cases N, et al. Subcell Biochem. 2012;65:53-74. doi: 10.1007/978-94-007-5416-4_3. Subcell Biochem. 2012. PMID: 23224999 Review. - Amyloid fibril formation and disaggregation of fragment 1-29 of apomyoglobin: insights into the effect of pH on protein fibrillogenesis.
Picotti P, De Franceschi G, Frare E, Spolaore B, Zambonin M, Chiti F, de Laureto PP, Fontana A. Picotti P, et al. J Mol Biol. 2007 Apr 13;367(5):1237-45. doi: 10.1016/j.jmb.2007.01.072. Epub 2007 Feb 3. J Mol Biol. 2007. PMID: 17320902 Review.
Cited by
- Beta-Lactoglobulin as a Model Food Protein: How to Promote, Prevent, and Exploit Its Unfolding Processes.
Barbiroli A, Iametti S, Bonomi F. Barbiroli A, et al. Molecules. 2022 Feb 8;27(3):1131. doi: 10.3390/molecules27031131. Molecules. 2022. PMID: 35164393 Free PMC article. Review. - Protein self-association in solution: the bovine beta -lactoglobulin dimer and octamer.
Gottschalk M, Nilsson H, Roos H, Halle B. Gottschalk M, et al. Protein Sci. 2003 Nov;12(11):2404-11. doi: 10.1110/ps.0305903. Protein Sci. 2003. PMID: 14573854 Free PMC article. - Ultrasound-induced protein restructuring and ordered aggregation to form amyloid crystals.
Pathak R, Bhangu SK, Martin GJO, Separovic F, Ashokkumar M. Pathak R, et al. Eur Biophys J. 2022 Jul;51(4-5):335-352. doi: 10.1007/s00249-022-01601-4. Epub 2022 May 16. Eur Biophys J. 2022. PMID: 35576075 Free PMC article. - Elucidating the role of disulfide bond on amyloid formation and fibril reversibility of somatostatin-14: relevance to its storage and secretion.
Anoop A, Ranganathan S, Das Dhaked B, Jha NN, Pratihar S, Ghosh S, Sahay S, Kumar S, Das S, Kombrabail M, Agarwal K, Jacob RS, Singru P, Bhaumik P, Padinhateeri R, Kumar A, Maji SK. Anoop A, et al. J Biol Chem. 2014 Jun 13;289(24):16884-903. doi: 10.1074/jbc.M114.548354. Epub 2014 Apr 29. J Biol Chem. 2014. PMID: 24782311 Free PMC article. - The Action of Chemical Denaturants: From Globular to Intrinsically Disordered Proteins.
Paladino A, Vitagliano L, Graziano G. Paladino A, et al. Biology (Basel). 2023 May 22;12(5):754. doi: 10.3390/biology12050754. Biology (Basel). 2023. PMID: 37237566 Free PMC article. Review.
References
- Alvarez, F., Alegría, A., and Colmenero, J. 1991. Relationship between the time-domain Kohlraush-Willams-Watts and frequency-domain Havriliak-Nagami relaxation functions. Phys. Rev. B 44 7306–7312. - PubMed
- Apenten, R.K.O. 1998. Protein stability function relations: β-Lactoglobulin-A sulphydryl group reactivity and its relationship to protein unfolding stability. Int. J. Biol. Macromol. 23, 19–25. - PubMed
- Bauer, R., Hansen, S., and Øgendal, L. 1998. Detection of intermediate oligomers, important for the formation of heat aggregates of β-lactoglobulin. Int. Dairy J. 8 105–112.
- Bellotti, V., Mangione, P., and Merlini, G. 2000. Review: Immunoglobulin light chain amyloidosis—the archetype of structural and pathogenic variability. J. Struct. Biol. 130 280–289. - PubMed
- Brownlow, S., Morais Cabral, J.H., Cooper, R., Flower, D.R., Yewdall, S. J., Polikarpov, I., North, A.C., and Sawyer, L. 1997. Bovine β-lactoglobulin at 1.8 Å resolution—still an enigmatic lipocalin. Structure 5 481–495. - PubMed
Publication types
MeSH terms
Substances
LinkOut - more resources
Full Text Sources
Other Literature Sources

