An optical marker based on the UV-induced green-to-red photoconversion of a fluorescent protein - PubMed (original) (raw)
An optical marker based on the UV-induced green-to-red photoconversion of a fluorescent protein
Ryoko Ando et al. Proc Natl Acad Sci U S A. 2002.
Abstract
We have cloned a gene encoding a fluorescent protein from a stony coral, Trachyphyllia geoffroyi, which emits green, yellow, and red light. The protein, named Kaede, includes a tripeptide, His-Tyr-Gly, that acts as a green chromophore that can be converted to red. The red fluorescence is comparable in intensity to the green and is stable under usual aerobic conditions. We found that the green-red conversion is highly sensitive to irradiation with UV or violet light (350-400 nm), which excites the protonated form of the chromophore. The excitation lights used to elicit red and green fluorescence do not induce photoconversion. Under a conventional epifluorescence microscope, Kaede protein expressed in HeLa cells turned red in a graded fashion in response to UV illumination; maximal illumination resulted in a 2,000-fold increase in the ratio of red-to-green signal. These color-changing properties provide a simple and powerful technique for regional optical marking. A focused UV pulse creates an instantaneous plane source of red Kaede within the cytosol. The red spot spreads rapidly throughout the cytosol, indicating its free diffusibility in the compartment. The extensive diffusion allows us to delineate a single neuron in a dense culture, where processes originating from many different somata are present. Illumination of a focused UV pulse onto the soma of a Kaede-expressing neuron resulted in filling of all processes with red fluorescence, allowing visualization of contact sites between the red and green neurons of interest.
Figures
Figure 1
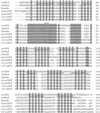
Amino acid sequence (single-letter code) alignment of no. 9 (Kaede) with avGFP (A. victoria GFP) (2), DsRed (3), and the following recently cloned fluorescent proteins (4): mcavGFP, mcavRFP, rfloGFP, and rfloRFP. The numbering is based on Aequorea GFP. In the sequence of avGFP, β-sheet-forming regions are underlined. Residues whose side chains form the interior of the β-can (3) are shaded. Residues responsible for chromophore synthesis are indicated by *.
Figure 2
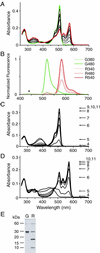
Spectra of green and red states of no. 9 (Kaede). (A) Absorption spectra of the unconverted green (green line) and converted red (red line) states. Spectra obtained during the green-red conversion are displayed as thin black lines. (B) G380 and G480: emission spectra of the green state (green line) on excitation at 380 and 480 nm, respectively. R340, R480, and R540: emission spectra of the red state (red line) on excitation at 340, 480, and 540 nm, respectively. The spectra of the green and red states were normalized with the highest values of G480 and R540, respectively. The small peak at 440 nm in G380 was caused by water raman and is indicated by *. (C) pH dependence of the green state absorbance. (D) pH dependence of the red state absorbance. (E) Band patterns of the green (G) and red (R) states of Kaede after SDS/PAGE and Coomassie brilliant blue staining.
Figure 3
Determination of the absolute molecular mass of Kaede protein. The molecular mass (dots) was calculated from MALS data and overlaid on the refractive index chromatogram (solid line).
Figure 4
Parameters that influence the photoconversion of Kaede expressed in HeLa cells. (A) A fluorescence micrograph of HeLa cells expressing green Kaede. (Scale bar: 20 μm.) (B) Time courses of R/G emission ratio with continuous illumination at 365 nm (365WB50; 3.5 W/cm2), 400 nm (400DF15; 1.6 W/cm2), 440 nm (440DF20; 2.8 W/cm2), and 470 nm (470DF35; 4.3 W/cm2). To observe fluorescence, cells were excited at 470 nm. A 1.6-W/cm2 beam of ≈400-nm light gave 90% of maximal photoconversion in 50 s; its quantum yield (19) was calculated to be 2.4 × 10⁻⁴. (C) Time courses of R/G emission ratio with continuous illumination at 380 nm (380HT15; 0.86 W/cm2), when intracellular pH was clamped to 6.0, 7.4, and 8.0. Cells were soaked in the pH buffers in the presence of 20 μM monensin and 20 μM nigericin.
Figure 5
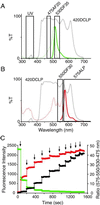
Dual-excitation and dual-emission ratiometric measurement of the photoconversion of Kaede. (A) Excitation (green dotted line) and emission (green solid line) spectra of green Kaede and the interference filters used for photoconversion or observation of green fluorescence. (B) Excitation (red dotted line) and emission (red solid line) spectra of red Kaede and the interference filters used for observation of red fluorescence. Band-pass and long-pass filters are indicated by boxes, with the transmission curve of the dichroic mirror 420DCLP (dotted line) in A and B. (C) Time course of green (green circles) and red (red circles) Kaede fluorescence intensity in HeLa cells and the R/G fluorescence signal ratio (black circles). Arrows indicate the 1-s UV pulses.
Figure 6
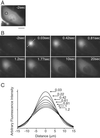
Rapid diffusion of red Kaede within the cytosol. (A) A fluorescence micrograph of a HeLa cell expressing green Kaede protein. The UV-exposed point is indicated by an open circle. (Scale bar: 20 μm.) (B) Representative images showing the emergence and spreading of the red fluorescence. Time after the end of the UV pulse is indicated in each picture. Images in A and B were taken by using the configuration shown in Fig. 4 A and B. (C) A series of fluorescence intensity-distance curves after the UV pulse. The fluorescence intensity along the line shown in the image at 0.03 s in B was analyzed. Each curve was fit by a Gaussian and is displayed. Time after the end of the UV pulse is indicated in the graph.
Figure 7
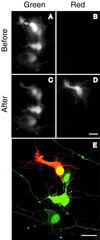
Visualization of an individual neuron in a hippocampal primary culture. (A and B) One day after transfection with Kaede cDNA, green and red fluorescence images were taken by using the configurations shown in Fig. 5 A and B, respectively. A spot in the cytosolic portion (indicated by a circle) of a neuron was UV-pulsed for 10 s. (C and D) Green and red fluorescence images 3 min after the UV pulse. (E) The red neuron and adjacent green neurons were imaged simultaneously by using confocal microscopy with 488/543-nm excitation and merged. A series of confocal images along z axis are projected. (Scale bar: 20 μm.)
Similar articles
- A green-emitting fluorescent protein from Galaxeidae coral and its monomeric version for use in fluorescent labeling.
Karasawa S, Araki T, Yamamoto-Hino M, Miyawaki A. Karasawa S, et al. J Biol Chem. 2003 Sep 5;278(36):34167-71. doi: 10.1074/jbc.M304063200. Epub 2003 Jun 19. J Biol Chem. 2003. PMID: 12819206 - Semi-rational engineering of a coral fluorescent protein into an efficient highlighter.
Tsutsui H, Karasawa S, Shimizu H, Nukina N, Miyawaki A. Tsutsui H, et al. EMBO Rep. 2005 Mar;6(3):233-8. doi: 10.1038/sj.embor.7400361. EMBO Rep. 2005. PMID: 15731765 Free PMC article. - Crystallographic evidence for water-assisted photo-induced peptide cleavage in the stony coral fluorescent protein Kaede.
Hayashi I, Mizuno H, Tong KI, Furuta T, Tanaka F, Yoshimura M, Miyawaki A, Ikura M. Hayashi I, et al. J Mol Biol. 2007 Sep 28;372(4):918-926. doi: 10.1016/j.jmb.2007.06.037. Epub 2007 Jun 19. J Mol Biol. 2007. PMID: 17692334 - Photoconvertible fluorescent protein EosFP: biophysical properties and cell biology applications.
Nienhaus GU, Nienhaus K, Hölzle A, Ivanchenko S, Renzi F, Oswald F, Wolff M, Schmitt F, Röcker C, Vallone B, Weidemann W, Heilker R, Nar H, Wiedenmann J. Nienhaus GU, et al. Photochem Photobiol. 2006 Mar-Apr;82(2):351-8. doi: 10.1562/2005-05-19-RA-533. Photochem Photobiol. 2006. PMID: 16613485 Review. - Primed conversion: The emerging player of precise and nontoxic photoconversion.
Kalyviotis K, Pantazis P. Kalyviotis K, et al. J Microsc. 2024 Nov;296(2):154-161. doi: 10.1111/jmi.13244. Epub 2023 Nov 15. J Microsc. 2024. PMID: 37937409 Review.
Cited by
- In vivo time-lapse imaging of cell proliferation and differentiation in the optic tectum of Xenopus laevis tadpoles.
Bestman JE, Lee-Osbourne J, Cline HT. Bestman JE, et al. J Comp Neurol. 2012 Feb 1;520(2):401-33. doi: 10.1002/cne.22795. J Comp Neurol. 2012. PMID: 22113462 Free PMC article. - Dcc regulates asymmetric outgrowth of forebrain neurons in zebrafish.
Gao J, Zhang C, Yang B, Sun L, Zhang C, Westerfield M, Peng G. Gao J, et al. PLoS One. 2012;7(5):e36516. doi: 10.1371/journal.pone.0036516. Epub 2012 May 14. PLoS One. 2012. PMID: 22606267 Free PMC article. - Adenosine signaling promotes regeneration of pancreatic β cells in vivo.
Andersson O, Adams BA, Yoo D, Ellis GC, Gut P, Anderson RM, German MS, Stainier DY. Andersson O, et al. Cell Metab. 2012 Jun 6;15(6):885-94. doi: 10.1016/j.cmet.2012.04.018. Epub 2012 May 17. Cell Metab. 2012. PMID: 22608007 Free PMC article. - Assessing the utility of photoswitchable fluorescent proteins for tracking intercellular protein movement in the Arabidopsis root.
Wu S, Koizumi K, Macrae-Crerar A, Gallagher KL. Wu S, et al. PLoS One. 2011;6(11):e27536. doi: 10.1371/journal.pone.0027536. Epub 2011 Nov 23. PLoS One. 2011. PMID: 22132108 Free PMC article. - In vivo multiphoton imaging of immune cell dynamics.
Okada T, Takahashi S, Ishida A, Ishigame H. Okada T, et al. Pflugers Arch. 2016 Nov;468(11-12):1793-1801. doi: 10.1007/s00424-016-1882-x. Epub 2016 Sep 22. Pflugers Arch. 2016. PMID: 27659161 Free PMC article. Review.
References
- Lippincott-Schwartz J, Snap E, Kenworthy A. Nat Rev Mol Cell Biol. 2001;2:444–456. - PubMed
- Tsien R Y. Annu Rev Biochem. 1998;67:509–544. - PubMed
- Matz M V, Fradokov A F, Labas Y A, Savitsky A P, Zaraisky A G, Markelov M L, Lukyanov S A. Nat Biotechnol. 1999;17:969–973. - PubMed
- Yokoe H, Meyer T. Nat Biotechnol. 1996;14:1252–1256. - PubMed
Publication types
MeSH terms
Substances
LinkOut - more resources
Full Text Sources
Other Literature Sources
Molecular Biology Databases
Research Materials
