Metapopulation dynamics and spatial heterogeneity in cancer - PubMed (original) (raw)
Metapopulation dynamics and spatial heterogeneity in cancer
Isabel González-García et al. Proc Natl Acad Sci U S A. 2002.
Abstract
With the advent of drugs targeting specific molecular defects in cancerous cells [Gorre, M. E., et al. (2001) Science 293, 876-880], it is important to understand the degree of genetic heterogeneity present in tumor cell populations and the rules that govern microdiversity in human cancer. Here, we first show that populations with different genotypes in genes influencing cell growth and programmed cell death coexist in advanced malignant tumors of the colon, exhibiting microsatellite instability. Detailed, physical mapping of the diverse populations shows them to be arranged in small, intermingling areas, resulting in a variegated pattern of diversity. Using computational modeling of the experimental data, we find that the coexistence between similar competitors is enhanced, instead of deterred, by spatial dynamics [Hanski, I. (1999) Metapopulation Dynamics (Oxford Univ. Press, New York)]. The model suggests a simple and plausible scenario for the generation of spatial heterogeneity during tumor progression. The emergence and persistence of the patterns of diversity encountered in the tumors can be generated without a need to invoke differences in mutation rates, neutrality of interactions, or separated time scales. We posit that the rules that apply to spatial ecology and explain the maintenance of diversity are also at work in tumors and may underlie tumor microheterogeneity.
Figures
Figure 1
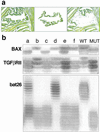
(a) The micrographs show how a tumoral glandular structure is acquired: from the field (Left), a single structure is lifted from the tissue (Center). The result (Right) verifies the purity of the microdissected cell population. Each pool of cells analyzed represents the population of tumor cells enclosed in a contiguous surface of 100 μm2. (b) The results of the genetic analysis can be interpreted easily for each of the selected areas. Lane e shows a BAX+/−; TGFβRII+/−; bat26−/−. Heterozygosity is not caused by contamination of normal cell elements because the DNA extracted from a single area often shows a mut/mut genotype for one of the three loci examined. The 27 possible genotypes for any given area make it unlikely that heterozygosity would be caused by an equal mixture of +/+ and −/− cells.
Figure 2
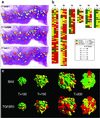
(a) The dappled pattern of heterogeneity is shown for one of the tumors studied. Note the diversity of genotypes generated when three loci are referred to a single area. The micrograph of the tumor also illustrates the advanced stage of the tumor growth, which penetrates the entire thickness of the intestinal wall. (b) Summary of results for the six tumors studied. Each gene is represented in a column, with each file through the three columns representing an independently sampled area of the tumor. In many instances, an area that contains cells with two mutated alleles (e.g., TGFβRII and bat26) and a WT BAX can be seen. Tumors are arranged from the most cellular to the least cellular because of large mucin pools. The mucinous tumors, although in the same size category, yielded less cellular areas for genotypic characterization. (c) The geographical distribution of clones in the model indicates that the parameters found by the algorithm are close to the experimental data. The optional parameters found by the search algorithm were: δ = 0.01, μ = 0.0021, _D_1 = 0.760, _D_2 = 0.376, _R_1 = 1.399, _R_2 = 1.413. A cross-section of the 3D representation generated by the model shows the intermingling of clones with diverse genotypes to be close to the experimental findings.
Figure 3
The robustness of the search algorithm is shown. (A) The average distance (●) and the distance to the target for the optimal solution (○) is shown (the SDs are obtained over 10 different runs of the search algorithm). After ≈40 generations, near-optimal solutions already are obtained. (B) An example of the optimal values obtained for the parameters controlling apoptosis: _D_1 (■) and _D_2 (□) (see model description). The SD is shown (under the same conditions as in A). The curves show that different runs of the search algorithm reach basically the same parameter values.
Similar articles
- Molecular mechanisms of inactivation of TGF-beta receptors during carcinogenesis.
Kim SJ, Im YH, Markowitz SD, Bang YJ. Kim SJ, et al. Cytokine Growth Factor Rev. 2000 Mar-Jun;11(1-2):159-68. doi: 10.1016/s1359-6101(99)00039-8. Cytokine Growth Factor Rev. 2000. PMID: 10708963 Review. - Gasdermin C Is Upregulated by Inactivation of Transforming Growth Factor β Receptor Type II in the Presence of Mutated Apc, Promoting Colorectal Cancer Proliferation.
Miguchi M, Hinoi T, Shimomura M, Adachi T, Saito Y, Niitsu H, Kochi M, Sada H, Sotomaru Y, Ikenoue T, Shigeyasu K, Tanakaya K, Kitadai Y, Sentani K, Oue N, Yasui W, Ohdan H. Miguchi M, et al. PLoS One. 2016 Nov 11;11(11):e0166422. doi: 10.1371/journal.pone.0166422. eCollection 2016. PLoS One. 2016. PMID: 27835699 Free PMC article. - Nuclear localization of Dpc4 (Madh4, Smad4) in colorectal carcinomas and relation to mismatch repair/transforming growth factor-beta receptor defects.
Montgomery E, Goggins M, Zhou S, Argani P, Wilentz R, Kaushal M, Booker S, Romans K, Bhargava P, Hruban R, Kern S. Montgomery E, et al. Am J Pathol. 2001 Feb;158(2):537-42. doi: 10.1016/s0002-9440(10)63995-8. Am J Pathol. 2001. PMID: 11159190 Free PMC article. - Dysfunctional transforming growth factor-beta receptor II accelerates prostate tumorigenesis in the TRAMP mouse model.
Pu H, Collazo J, Jones E, Gayheart D, Sakamoto S, Vogt A, Mitchell B, Kyprianou N. Pu H, et al. Cancer Res. 2009 Sep 15;69(18):7366-74. doi: 10.1158/0008-5472.CAN-09-0758. Epub 2009 Sep 8. Cancer Res. 2009. PMID: 19738062 Free PMC article. - The type II transforming growth factor-beta receptor as a tumor-suppressor gene.
Brattain MG, Markowitz SD, Willson JK. Brattain MG, et al. Curr Opin Oncol. 1996 Jan;8(1):49-53. doi: 10.1097/00001622-199601000-00009. Curr Opin Oncol. 1996. PMID: 8868100 Review.
Cited by
- A "conversion-deterioration-double mutation" theory for the evolution and progression of colorectal cancer.
Wang R, Yan Z. Wang R, et al. Cancer Med. 2022 Jul;11(13):2601-2611. doi: 10.1002/cam4.4637. Epub 2022 Mar 13. Cancer Med. 2022. PMID: 35285179 Free PMC article. Review. - Tumor heterogeneity: causes and consequences.
Marusyk A, Polyak K. Marusyk A, et al. Biochim Biophys Acta. 2010 Jan;1805(1):105-17. doi: 10.1016/j.bbcan.2009.11.002. Epub 2009 Nov 18. Biochim Biophys Acta. 2010. PMID: 19931353 Free PMC article. Review. - Molecular Subtyping of Cancer Based on Robust Graph Neural Network and Multi-Omics Data Integration.
Yin C, Cao Y, Sun P, Zhang H, Li Z, Xu Y, Sun H. Yin C, et al. Front Genet. 2022 May 13;13:884028. doi: 10.3389/fgene.2022.884028. eCollection 2022. Front Genet. 2022. PMID: 35646077 Free PMC article. - Mutational load distribution analysis yields metrics reflecting genetic instability during pancreatic carcinogenesis.
Tarafa G, Tuck D, Ladner D, Topazian M, Brand R, Deters C, Moreno V, Capella G, Lynch H, Lizardi P, Costa J. Tarafa G, et al. Proc Natl Acad Sci U S A. 2008 Mar 18;105(11):4306-11. doi: 10.1073/pnas.0708250105. Epub 2008 Mar 12. Proc Natl Acad Sci U S A. 2008. PMID: 18337498 Free PMC article. - Pathology to enhance precision medicine in oncology: lessons from landscape ecology.
Lloyd MC, Rejniak KA, Brown JS, Gatenby RA, Minor ES, Bui MM. Lloyd MC, et al. Adv Anat Pathol. 2015 Jul;22(4):267-72. doi: 10.1097/PAP.0000000000000078. Adv Anat Pathol. 2015. PMID: 26050264 Free PMC article. Review.
References
- Nowell P C. Science. 1976;194:23–28. - PubMed
- Waghorne C, Thomas M, Lagarde A, Kerbel R S, Breitman M-L. Cancer Res. 1988;48:6109–6114. - PubMed
- Fearon E-R, Vogelstein B. Cell. 1990;61:759–767. - PubMed
- Cavenee W-K, Scrable H-J, James C-D. Mutat Res. 1991;247:199–202. - PubMed
- Boland C-R, Sato J, Appelman H-D, Bresalier R-S, Feinberg A-P. Nat Med. 1995;1:902–909. - PubMed
Publication types
MeSH terms
Substances
LinkOut - more resources
Full Text Sources
Other Literature Sources


