Single channel properties of rat acid-sensitive ion channel-1alpha, -2a, and -3 expressed in Xenopus oocytes - PubMed (original) (raw)
Single channel properties of rat acid-sensitive ion channel-1alpha, -2a, and -3 expressed in Xenopus oocytes
Ping Zhang et al. J Gen Physiol. 2002 Oct.
Abstract
The mammalian nervous system expresses proton-gated ion channels known as acid-sensing ion channels (ASICs). Depending on their location and specialization some neurons express more than one type of ASIC where they may form homo- or heteromeric channels. Macroscopic characteristics of the ASIC currents have been described, but little is known at the single channel level. Here, we have examined the properties of unitary currents of homomeric rat ASIC1alpha, ASIC2a, and ASIC3 expressed in Xenopus oocytes with the patch clamp technique. We describe and characterize properties unique to each of these channels that can be used to distinguish the various types of ASIC channels expressed in mammalian neurons. The amplitudes of the unitary currents in symmetrical Na(+) are similar for the three types of channels (23-18 pS) and are not voltage dependent. However, ASIC1alpha exhibits three subconductance states, ASIC2a exhibits only one, and ASIC3 none. The kinetics of the three types of channels are different: ASIC1alpha and ASIC2a shift between modes of activity, each mode has different open probability and kinetics. In contrast, the kinetics of ASIC3 are uniform throughout the burst of activity. ASIC1alpha, ASIC2a, and ASIC3 are activated by external protons with apparent pH(50) of 5.9, 5.0, and 5.4, respectively. Desensitization in the continual presence of protons is fast and complete in ASIC1alpha and ASIC3 (2.0 and 4.5 s(-1), respectively) but slow and only partial in ASIC2a (0.045 s(-1)). The response to external Ca(2+) also differs: micro M concentrations of extracellular Ca(2+) are necessary for proton gating of ASIC3 (EC(50) = 0.28 micro M), whereas ASIC1alpha and ASIC2a do not require Ca(2+). In addition, Ca(2+) inhibits ASIC1alpha (K(D) = 9.2 +/- 2 mM) by several mechanisms: decrease in the amplitude of unitary currents, shortening of the burst of activity, and decrease in the number of activated channels. Contrary to previous reports, our results indicate that the Ca(2+) permeability of ASIC1alpha is very small.
Figures
Figure 1.
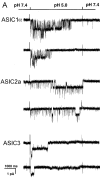
(A**)** Representative examples of homomeric ASIC1α, ASIC2a, and ASIC3 channels recorded from outside-out patches of injected oocytes. Activation of channels was achieved by rapid changes of the solution bating the tip of the patch pipette from pHo 7.4 to 5.0 according to the protocol shown on the bar above the channel traces. The spikes in the records are noise introduced by the change in solution. The three types of channels open rapidly upon lowering the pHo to 5.0. ASIC1α and ASIC3 channels close in the continual presence of external protons, whereas ASIC2a remain open during the 5-s period of application of pHo 5.0. Recordings were performed with symmetrical 150 mM Na+, 1 mM Ca2+ in the outside solution and 0 mM Ca2+ plus 1 mM EDTA in the pipette. Membrane voltage was −60 mV in the pipette. The scale bars indicate the time and current amplitude for all the records shown. (B) Whole-cell currents from oocytes injected with ASIC1α, ASIC2a, or ASIC3 were recorded with the TEVC in the presence of 150 mM Na+ and 1 mM Ca2+ and at a membrane potential of −60 mV. Currents were activated by rapid changes in pHo from 7.4 to 5.0 as indicated by the bar above the traces. Desensitization in the continual presence of protons is faster for ASIC3>ASIC1α>>>ASIC2a. The scale bars indicate the time and current amplitude; notice that for ASIC2a the time scale is 10-fold larger.
Figure 2.
Current-voltage relationships of unitary currents from ASIC1α, ASIC2a, and ASIC3 channels recorded in symmetrical 150 mM Na+ and 1 mM Ca2+ only in the outside solution. Channels were activated by solutions of pHo 5.0. All three channels exhibit linear I-V curves at negative voltages and the amplitudes of the unitary currents are similar for the three channels although, slightly smaller for ASIC3.
Figure 3.
Subconductances of ASIC1α. (A) Unitary currents from ASIC1α activated by pHo 6.0 and 5.0 from outside-out patches. For each example, low (500 ms) and high (50 ms) time resolution displays are shown. The dotted lines indicate current levels: a full open state (O) and three subconductance states S1, S2, and S3.. (B) Channels opening first to sublevel S1 and then to the fully open state. The example on the right shows also a transition to S3 with amplitude of 1.8 pA. (C) Examples of channel desensitization proceeding through several subconductances before the closed state is reached. (D) All points histogram of the amplitude of sublevels (in pA): S1 = 0.55, S2 = 1.0, and O = 2.0. The line represents the fit with four Gaussian components Currents were recorded with 150 mM Na+ and 0 mM Ca2+ in the outside solution and 150 mM K+ in the pipette. Pipette voltage was −60 mV. Bars indicate time and amplitude scales. For display data were filtered at 0.5 kHz.
Figure 4.
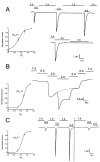
Activation and desensitization of ASIC whole-cell currents by external protons. Currents from oocytes injected with ASIC1α, ASIC2, or ASIC3 were examined with the TEVC in the presence of 150 mM Na+, 1 mM Ca2+ at −60 mV of membrane potential. In the upper trace from A an oocyte expressing ASIC1α was activated by sequential exposure to solutions of pHo 6.0, 5.0, and 4.0. Between each test solution, the bath was returned to 7.4 for 25 s. Peak currents were normalized to the value obtained at pHo 4.0 and the data were fitted with the equation I = Imax/1 + pH50/[pHo], and apparent pH50 of 5.85 ± 0.25. The lower trace shows activation of currents with pHo 6.0 but no effect if the pHo is changed directly to pHo 5.0. (B) Activation of ASIC2a channels by sequential exposure to progressively lower pHos without returning to pHo 7.4. The desensitization rate is pHo dependent being faster at pHo 4.0 than 5.0. The dotted line indicates desensitization at pHo 5. Peak currents obtained at each pHo were used to calculate the apparent pH50, 5.0 ± 0.12. (C) Oocyte expressing ASIC3 was exposed to a protocol similar to the one in A. Indicated in the second part of the experiment, after the vertical dotted line, changes in pHo from 6.0 to 5.0 failed to activate channels. The value of the apparent pH50 was 5.4 ± 0.2. Scales of time and current amplitude are indicated by the bars in each panel. The pH50 ± SD for each type of channel was calculated from five to eight oocytes.
Figure 5.
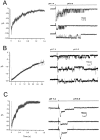
Desensitization rates of ASIC1α (A), ASIC2a (B), and ASIC3 (C). (A) Unitary currents from ASIC1α, ASIC2a, or ASIC3 channels activated by pHo 5.0 were added and the resulting currents were fitted with a single exponential, Eq. 1, with calculated desensitization rates of 2 s−1, 0.045 s−1 and 4.5 s−1, respectively. On the right side of the figure there are shown 3 out of 12–14 patches used to generate the desensitization curves. Time and amplitude are indicated by the scale bars.
Figure 6.
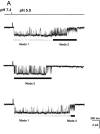
(A) Representative examples of kinetic modes of ASIC1α unitary currents. The bars under the traces indicate the modes of activity: Mode 1 and Mode 2. Upon exposure to pHo 5.0 channels first open to a high Po mode with few brief closures (Mode 1). Activity suddenly changes to Mode 2, which has lower Po and frequent closures, giving a flickering appearance to the records. Many subconductances are detected in Mode 2 in particular, before entering the desensitized state. (B) ASIC2a exhibits two modes of activity that can be distinguished by their different Po. Mode 1 is characterized by high Po (0.74) and long open events, whereas Mode 2 has a much lower Po (0.073), openings are very brief and closures are long. Bars indicate time and amplitude scales. (C) Dwell-time histograms of open and closed events from each of the two modes of activity of ASIC1α. Records of single channel patches were visually inspected to select segments with typical modal behavior that serve for the generation of histograms. Lines represent the fit of the data to two exponentials. The mean time constant (ms) and relative area (parentheses) are: Mode 1, τo 1.0 (0.29) and 52.5 (0.71), τc 0.8 (0.9) and 10.6 (0.1); Mode 2, τo 3.0 (0.72) and 17.2 (0.28), τc 1.4 (0.78), and 10.6 (0.22). (D) Dwell-time histograms of open and closed events from each of the two modes of activity of ASIC2a. The mean time constant (ms) and relative area (parentheses) are: Mode 1, τo 58.07 (0.517) and 3.86 ms (0.483), and τc 17.95 ms (0.25) and 0.99 ms (0.75). Mode 2, τo 6.32 ms (0.124) and 1.45 ms (0.876), and τc 159 ms (0.432) and 1.2 ms (56.8).
Figure 7.
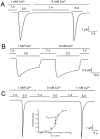
Effect of external Ca2+ on the activation of homomeric ASIC channels. Whole cell currents from oocytes injected with ASIC1α (A), ASIC2 (B), or ASIC3 (C) were activated by pHo 5.0 in the presence of absence of 1 mM Ca2+ in the bath solution. Only ASIC3 requires external Ca2+ for activation by protons with an apparent CE50 of 0.28 mM (inset in C). Recordings were performed with TEVC, 150 mM Na+ in the bath and −60 mV membrane potential. Time and amplitude are indicated by the scale bars.
Figure 8.
Two examples of ASIC1α outside-out patches activated by exposure to Ca2+-free solution (no added Ca2+ plus 1 mM EDTA) buffered at pHo 5.0. Notice that at pHo 7.4 in the Ca2+-free solution, no channel activity is detected.
Figure 9.
(A) Effects of varying the molar ratio of Na+ and Ca2+ on the conductance of ASIC1α. The Na+/Ca2+ molar ratios of the external solutions were (in mM): 150/0, 140/5, 130/10, 110/20, 50/50, and 0/75. (B) Current-voltage relationship of unitary currents of ASIC1α in symmetrical 150 NaCl and either 0 (filled circles) or 10 mM Ca2+ (clear circles). Each data point represents the mean ± SD of four to five patches.
Figure 10.
Effects of external Ca2+ on the activity of ASIC1α unitary currents. (A) Activation of a multichannel patch with pHo 5.0 and 0 mM Ca2+ (top trace) followed by recovery at pHo 7.4 and reactivation with pHo 5.0 in the presence of 10 mM Ca2+ (bottom trace). External Ca2+ reduced the amplitude of the unitary currents, decreased the number of activated channels in the patch from three to one, and shortened the length of the burst of activity. (B) Histograms of bursts duration of ASIC1α in the presence of increasing concentrations of Ca2+. Patches were activated by pHo 5.0 solutions containing increasing concentrations of Ca2+: 0 mM, 5.0 mM or ≥10 mM (10, 20, 50, 75). Length of bursts were computed and sorted for the generation of histograms. The number of patches examined were: 83 with 0 mM Ca2+, 21 with 5 mM, and 62 with ≥10 mM. (C) Apparent half maximal inhibition of ASIC1α whole-cell currents by Ca2+. Currents from oocytes were activated by changes in pHo from 7.4 to 5.0 in the presence of 150 mM NaCl and increasing concentrations of external Ca2+. Measurements were obtained with TEVC at −60 mV. The line represents the fit of the data to Eq. 2 with KD value of 9.2 ± 0.22 mM. Each data point is the mean ± SD of five oocytes.
Similar articles
- Mammalian ASIC2a and ASIC3 subunits co-assemble into heteromeric proton-gated channels sensitive to Gd3+.
Babinski K, Catarsi S, Biagini G, Séguéla P. Babinski K, et al. J Biol Chem. 2000 Sep 15;275(37):28519-25. doi: 10.1074/jbc.M004114200. J Biol Chem. 2000. PMID: 10842183 - Functional characterization of acid-sensing ion channels in cultured neurons of rat inferior colliculus.
Zhang M, Gong N, Lu YG, Jia NL, Xu TL, Chen L. Zhang M, et al. Neuroscience. 2008 Jun 23;154(2):461-72. doi: 10.1016/j.neuroscience.2008.03.040. Epub 2008 Mar 26. Neuroscience. 2008. PMID: 18456416 - Peptides inhibitors of acid-sensing ion channels.
Diochot S, Salinas M, Baron A, Escoubas P, Lazdunski M. Diochot S, et al. Toxicon. 2007 Feb;49(2):271-84. doi: 10.1016/j.toxicon.2006.09.026. Epub 2006 Oct 4. Toxicon. 2007. PMID: 17113616 Review. - Voltage-gated proton channels in microglia.
Eder C, DeCoursey TE. Eder C, et al. Prog Neurobiol. 2001 Jun;64(3):277-305. doi: 10.1016/s0301-0082(00)00062-9. Prog Neurobiol. 2001. PMID: 11240310 Review.
Cited by
- δ ENaC: a novel divergent amiloride-inhibitable sodium channel.
Ji HL, Zhao RZ, Chen ZX, Shetty S, Idell S, Matalon S. Ji HL, et al. Am J Physiol Lung Cell Mol Physiol. 2012 Dec 15;303(12):L1013-26. doi: 10.1152/ajplung.00206.2012. Epub 2012 Sep 14. Am J Physiol Lung Cell Mol Physiol. 2012. PMID: 22983350 Free PMC article. Review. - Divalent cation and chloride ion sites of chicken acid sensing ion channel 1a elucidated by x-ray crystallography.
Yoder N, Gouaux E. Yoder N, et al. PLoS One. 2018 Aug 29;13(8):e0202134. doi: 10.1371/journal.pone.0202134. eCollection 2018. PLoS One. 2018. PMID: 30157194 Free PMC article. - Distinct roles for two Caenorhabditis elegans acid-sensing ion channels in an ultradian clock.
Kaulich E, Carroll T, Ackley BD, Tang YQ, Hardege I, Nehrke K, Schafer WR, Walker DS. Kaulich E, et al. Elife. 2022 Jun 6;11:e75837. doi: 10.7554/eLife.75837. Elife. 2022. PMID: 35666106 Free PMC article. - Interaction of the aromatics Tyr-72/Trp-288 in the interface of the extracellular and transmembrane domains is essential for proton gating of acid-sensing ion channels.
Li T, Yang Y, Canessa CM. Li T, et al. J Biol Chem. 2009 Feb 13;284(7):4689-94. doi: 10.1074/jbc.M805302200. Epub 2008 Dec 11. J Biol Chem. 2009. PMID: 19074149 Free PMC article. - In silico screening of GMQ-like compounds reveals guanabenz and sephin1 as new allosteric modulators of acid-sensing ion channel 3.
Callejo G, Pattison LA, Greenhalgh JC, Chakrabarti S, Andreopoulou E, Hockley JRF, Smith ESJ, Rahman T. Callejo G, et al. Biochem Pharmacol. 2020 Apr;174:113834. doi: 10.1016/j.bcp.2020.113834. Epub 2020 Feb 3. Biochem Pharmacol. 2020. PMID: 32027884 Free PMC article.
References
- Akopian, A.N., C.C. Chen, Y. Ding, P. Cesare, and J.N. Wood. 2000. A new member of the acid-sensing ion channel family. Neuroreport. 11:2217–2222. - PubMed
- Askwith, C.C., C. Cheng, M. Ikuma, C. Benson, M.P. Price, and M.J. Welsh. 2000. Neuropeptide FF and FMRFamide potentiate acid-evoked currents from sensory neurons and proton-gated DEG/ENaC channels. Neuron. 26:133–141. - PubMed
- Babinski, K., S. Catarsi, G. Biagini, and P. Séguéla. 2000. Mammalian ASIC2a and ASIC3 subunits co-assemble into heteromeric proton-gated channels sensitive to Gd3+. J. Biol. Chem. 275:28519–28525. - PubMed
- Baron, A., L. Schaefer, E. Lingueglia, G. Champigny, and M. Lazdunski. 2001. Zn2+ and H+ are coactivators of acid-sensing ion channels. J. Biol. Chem. 276:35361–35367. - PubMed
Publication types
MeSH terms
Substances
LinkOut - more resources
Full Text Sources
Other Literature Sources
Miscellaneous
