Neurotoxic effects of thioflavin S-positive amyloid deposits in transgenic mice and Alzheimer's disease - PubMed (original) (raw)
Neurotoxic effects of thioflavin S-positive amyloid deposits in transgenic mice and Alzheimer's disease
B Urbanc et al. Proc Natl Acad Sci U S A. 2002.
Abstract
Despite extensive deposition of putatively neurotoxic amyloid-beta (Abeta) protein in the brain, it has not been possible to demonstrate an association of Abeta deposits with neuronal loss in Alzheimer's disease (AD), and neuronal loss is minimal in transgenic mouse models of AD. Using triple immunostaining confocal microscopy and analyzing the images with the cross-correlation density map method from statistical physics, we directly compared Abeta deposition, Abeta morphology, and neuronal architecture. We found dramatic, focal neuronal toxicity associated primarily with thioflavin S-positive fibrillar Abeta deposits in both AD and PSAPP mice. These results, along with computer simulations, suggest that Abeta develops neurotoxic properties in vivo when it adopts a fibrillar beta-pleated sheet conformation.
Figures
Fig 1.
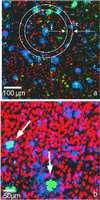
(a) Color superposition of triple-labeled images of human brain tissue (AD case) from a dual photon microscope showing coregistration of neurons with Aβ-immunoreactive and ThioS-labeled deposits in layer III of the STS: Neu-N-stained neurons (red), Aβ-immunoreactive deposits (blue), and ThioS labeling (green), showing tangles in addition to ThioS-positive Aβ deposits. A schematic picture of concentric rings around one deposit illustrates the density map method used in the calculation. ThioS-positive Aβ channel (green) was used to classify the plaques into ThioS-positive and non-ThioS deposits. (b) Color superposition of confocal double-labeled immunostained images of transgenic mouse brain tissue showing coregistration of neurons (red) with Aβ-immunoreactive (blue) and ThioS-labeled (green) deposits. The arrows point to two ThioS deposits that coincide with two holes in the neuronal density.
Fig 2.
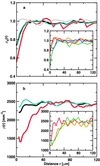
(a) Normalized neuronal density ρN(r) averaged over five AD cases with average neuron densities of 1,563, 763, 1,087, 1,597, and 862 neurons per mm2 for (i) all Aβ deposits with n = 1,287 (black), (ii) non-ThioS Aβ deposits with n = 996 (cyan), (iii) ThioS-positive Aβ deposits with n = 223 (red), and (iv) randomly shuffled Aβ deposits with n = 1,287 (gray). (Inset) Normalized neuronal density ρN(r) for different size classes of Aβ deposits with respect to the radius R of the deposit, averaged over five different AD cases: (i) R < 7 μm (red), (_ii_) 7 < _R_ < 10 μm (orange), (_iii_) 10 < _R_ < 15 μm (green), and (_iv_) _R_ > 15 μm (blue). (b) Neuronal density ρ(r) in transgenic mice with an average neuronal density of 2,468 per mm2 with respect to the center of mass of the Aβ deposits. We plot ρ(r) for all Aβ deposits with n = 982 (black), non-ThioS (cyan) with n = 819, and ThioS-positive (red) Aβ deposits with n = 166. (Inset) Neuronal densities ρ(r) around ThioS-positive Aβ deposits of different effective radia R: (i) R < 12.3 μm (red) with _n_ = 31, (_ii_) 12.3 < _R_ < 24.8 μm (orange) with _n_ = 78, and (_iii_) _R_ > 24.8 μm (green) with n = 58.
Fig 3.
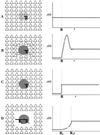
Schematic pictures and diagrams for possible biological scenarios of Aβ deposit effects on neuronal landscape. (A) Nontoxic diffuse deposit. (B) Nontoxic deposit displacing neurons. (C) Focally toxic deposit. (D) Focally toxic deposit with a toxic penumbra.
Fig 4.
(a) Neuronal density ρ(r) from the molecular dynamics simulations for the nontoxic and toxic model. In each case, ρ(r) is averaged over a set of sizes obtained from the ThioS size distribution with n = 254. Neuronal density ρ(r) for the nontoxic model shows a rather prominent peak of neuronal density that would correspond to a denser ring of neurons around the deposit. Neuronal density ρ(r) for the toxic model displays no such peak, indicating that neurons are not merely pushed away as the deposit grows but rather destroyed. The Insets correspond to typical computer realizations for each model, where the initial position for the nonoverlapping small circles (model neurons) is random and the total density and radius [_N_neu = 1,850 in a 512 × 512 pixel2 box, R = 4 pixels (3.5 μm)] is taken to be equivalent to the average density and radius of neurons in the PSAPP transgenic mice. The central deposit (only the hole shown) in each Inset has a radius of 18 pixels (15.7 μm). (b) Neuronal density ρ(r) in dependence on the distance from the surface of a ThioS core in transgenic mice. For each deposit ρ(r) is shifted by the radius of the ThioS core. Individual functions ρ(r) are then averaged over all 281 ThioS cores. (Inset) A confocal image of Neu-N-stained PsAPP mouse brain showing a hole in the otherwise rather homogeneous distribution of neurons.
Similar articles
- Age-related amyloid beta deposition in transgenic mice overexpressing both Alzheimer mutant presenilin 1 and amyloid beta precursor protein Swedish mutant is not associated with global neuronal loss.
Takeuchi A, Irizarry MC, Duff K, Saido TC, Hsiao Ashe K, Hasegawa M, Mann DM, Hyman BT, Iwatsubo T. Takeuchi A, et al. Am J Pathol. 2000 Jul;157(1):331-9. doi: 10.1016/s0002-9440(10)64544-0. Am J Pathol. 2000. PMID: 10880403 Free PMC article. - Tg-SwDI transgenic mice exhibit novel alterations in AbetaPP processing, Abeta degradation, and resilient amyloid angiopathy.
Van Vickle GD, Esh CL, Daugs ID, Kokjohn TA, Kalback WM, Patton RL, Luehrs DC, Walker DG, Lue LF, Beach TG, Davis J, Van Nostrand WE, Castaño EM, Roher AE. Van Vickle GD, et al. Am J Pathol. 2008 Aug;173(2):483-93. doi: 10.2353/ajpath.2008.071191. Epub 2008 Jul 3. Am J Pathol. 2008. PMID: 18599612 Free PMC article. - Mostly separate distributions of CLAC- versus Abeta40- or thioflavin S-reactivities in senile plaques reveal two distinct subpopulations of beta-amyloid deposits.
Kowa H, Sakakura T, Matsuura Y, Wakabayashi T, Mann DM, Duff K, Tsuji S, Hashimoto T, Iwatsubo T. Kowa H, et al. Am J Pathol. 2004 Jul;165(1):273-81. doi: 10.1016/s0002-9440(10)63295-6. Am J Pathol. 2004. PMID: 15215182 Free PMC article. - Abeta as a bioflocculant: implications for the amyloid hypothesis of Alzheimer's disease.
Robinson SR, Bishop GM. Robinson SR, et al. Neurobiol Aging. 2002 Nov-Dec;23(6):1051-72. doi: 10.1016/s0197-4580(01)00342-6. Neurobiol Aging. 2002. PMID: 12470802 Review.
Cited by
- Fine mapping of the amyloid β-protein binding site on myelin basic protein.
Kotarba AE, Aucoin D, Hoos MD, Smith SO, Van Nostrand WE. Kotarba AE, et al. Biochemistry. 2013 Apr 16;52(15):2565-73. doi: 10.1021/bi4001936. Epub 2013 Apr 4. Biochemistry. 2013. PMID: 23510371 Free PMC article. - Linalool Alleviates A_β_42-Induced Neurodegeneration via Suppressing ROS Production and Inflammation in Fly and Rat Models of Alzheimer's Disease.
Yuan C, Shin M, Park Y, Choi B, Jang S, Lim C, Yun HS, Lee IS, Won SY, Cho KS. Yuan C, et al. Oxid Med Cell Longev. 2021 Mar 10;2021:8887716. doi: 10.1155/2021/8887716. eCollection 2021. Oxid Med Cell Longev. 2021. PMID: 33777322 Free PMC article. - Transgenic models of Alzheimer's disease: learning from animals.
Spires TL, Hyman BT. Spires TL, et al. NeuroRx. 2005 Jul;2(3):423-37. doi: 10.1602/neurorx.2.3.423. NeuroRx. 2005. PMID: 16389306 Free PMC article. Review. - Multimodal Imaging of Amyloid Plaques: Fusion of the Single-Probe Mass Spectrometry Image and Fluorescence Microscopy Image.
Tian X, Xie B, Zou Z, Jiao Y, Lin LE, Chen CL, Hsu CC, Peng J, Yang Z. Tian X, et al. Anal Chem. 2019 Oct 15;91(20):12882-12889. doi: 10.1021/acs.analchem.9b02792. Epub 2019 Sep 26. Anal Chem. 2019. PMID: 31536324 Free PMC article. - Tau passive immunization blocks seeding and spread of Alzheimer hyperphosphorylated Tau-induced pathology in 3 × Tg-AD mice.
Dai CL, Hu W, Tung YC, Liu F, Gong CX, Iqbal K. Dai CL, et al. Alzheimers Res Ther. 2018 Jan 31;10(1):13. doi: 10.1186/s13195-018-0341-7. Alzheimers Res Ther. 2018. PMID: 29386065 Free PMC article.
References
- Selkoe D. (1994) J. Neuropathol. Exp. Neurol. 53, 438-447. - PubMed
- Goate A., Chartier-Harlin, M.-C., Mullan, M., Brown, J., Crawford, F., Fidani, L., Giuffra, L., Haynes, A., Irving, N., James, L., et al. (1991) Nature 349, 704-706. - PubMed
- Citron M., Oltersdorf, T., Haass, C., McConlogue, L., Hung, A. Y., Seubert, P., Vigopelfrey, C., Lieberburg, I. & Selkoe, D. J. (1992) Nature 360, 672-674. - PubMed
- Cai X.-D., Golde, T. E. & Younkin, S. G. (1993) Science 259, 514-516. - PubMed
- Duff K., Eckman, C., Zehr, C., Yu, X., Prada, C. M., Perez-tur, J., Hutton, M., Buee, L., Harigaya, Y., Yager, D., et al. (1996) Nature 383, 710-713. - PubMed
Publication types
MeSH terms
Substances
Grants and funding
- P01 AG015379/AG/NIA NIH HHS/United States
- AG15379/AG/NIA NIH HHS/United States
- AG00793/AG/NIA NIH HHS/United States
- P41 RR13622/RR/NCRR NIH HHS/United States
- R01 AG008487/AG/NIA NIH HHS/United States
- P01 AG015453/AG/NIA NIH HHS/United States
- P41 RR013622/RR/NCRR NIH HHS/United States
- AG15453/AG/NIA NIH HHS/United States
- P01 AG017216/AG/NIA NIH HHS/United States
- AG17216/AG/NIA NIH HHS/United States
- AG08487/AG/NIA NIH HHS/United States
LinkOut - more resources
Full Text Sources
Medical


