Birth and death of protein domains: a simple model of evolution explains power law behavior - PubMed (original) (raw)
Birth and death of protein domains: a simple model of evolution explains power law behavior
Georgy P Karev et al. BMC Evol Biol. 2002.
Abstract
Background: Power distributions appear in numerous biological, physical and other contexts, which appear to be fundamentally different. In biology, power laws have been claimed to describe the distributions of the connections of enzymes and metabolites in metabolic networks, the number of interactions partners of a given protein, the number of members in paralogous families, and other quantities. In network analysis, power laws imply evolution of the network with preferential attachment, i.e. a greater likelihood of nodes being added to pre-existing hubs. Exploration of different types of evolutionary models in an attempt to determine which of them lead to power law distributions has the potential of revealing non-trivial aspects of genome evolution.
Results: A simple model of evolution of the domain composition of proteomes was developed, with the following elementary processes: i) domain birth (duplication with divergence), ii) death (inactivation and/or deletion), and iii) innovation (emergence from non-coding or non-globular sequences or acquisition via horizontal gene transfer). This formalism can be described as a birth, death and innovation model (BDIM). The formulas for equilibrium frequencies of domain families of different size and the total number of families at equilibrium are derived for a general BDIM. All asymptotics of equilibrium frequencies of domain families possible for the given type of models are found and their appearance depending on model parameters is investigated. It is proved that the power law asymptotics appears if, and only if, the model is balanced, i.e. domain duplication and deletion rates are asymptotically equal up to the second order. It is further proved that any power asymptotic with the degree not equal to -1 can appear only if the hypothesis of independence of the duplication/deletion rates on the size of a domain family is rejected. Specific cases of BDIMs, namely simple, linear, polynomial and rational models, are considered in details and the distributions of the equilibrium frequencies of domain families of different size are determined for each case. We apply the BDIM formalism to the analysis of the domain family size distributions in prokaryotic and eukaryotic proteomes and show an excellent fit between these empirical data and a particular form of the model, the second-order balanced linear BDIM. Calculation of the parameters of these models suggests surprisingly high innovation rates, comparable to the total domain birth (duplication) and elimination rates, particularly for prokaryotic genomes.
Conclusions: We show that a straightforward model of genome evolution, which does not explicitly include selection, is sufficient to explain the observed distributions of domain family sizes, in which power laws appear as asymptotic. However, for the model to be compatible with the data, there has to be a precise balance between domain birth, death and innovation rates, and this is likely to be maintained by selection. The developed approach is oriented at a mathematical description of evolution of domain composition of proteomes, but a simple reformulation could be applied to models of other evolving networks with preferential attachment.
Figures
Figure 1
Domain dynamics and elementary evolutionary events under BDIM.
Figure 2
Different orders of balance in BDIMs.
Figure 3
Asymptotics of equilibrium distributions for balanced BDIMs of different orders.
Figure 4
The hierarchy of BDIM types.
Figure 5
Dependence of per domain birth and death rates on the domain family size for the second-order balanced linear BDIM.
Figure 6
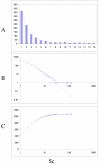
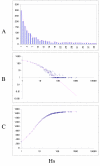
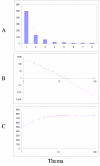
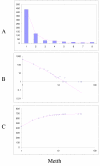
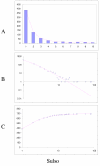
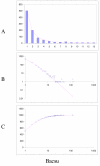
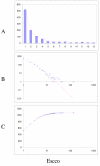
Fit of empirical domain family size distributions to the second-order balanced linear BDIM: the yeast Saccharomyces cerevisiae. A. Distribution of the size of domain families grouped into bins B. Domain family size distribution in double logarithmic coordinates. Magenta line: f i = 11521Γ(i+1.55)/Γ(i+4.27) C. Cumulative distribution function of domain family size. The line shows the prediction of the second-order balanced linear BDIM.
Figure 7
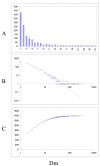
Fit of empirical domain family size distributions to the second-order balanced linear BDIM: the fruit fly Drosophila melanogaster. The panels and the designations are as in Fig. 6. B. Magenta line: f i = 5258Γ(i+1.62)/Γ(i+3.79)
Figure 8
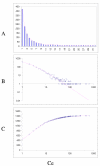
Fit of empirical domain family size distributions to the second-order balanced linear BDIM: the nematode worm Caenorhabditis elegans. The panels and the designations are as in Fig. 6. B. Magenta line: f i = 2453Γ(i+1.13)/Γ(i+3.03)
Figure 9
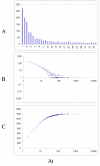
Fit of empirical domain family size distributions to the second-order balanced linear BDIM: the thale cress Arabidopsis thaliana. The panels and the designations are as in Fig. 6. B. Magenta line: f i = 10750Γ(i+3.80)/Γ(i+5.98)
Figure 10
Fit of empirical domain family size distributions to the second-order balanced linear BDIM: Homo sapiens. The panels and the designations are as in Fig. 6. B. Magenta line: f i = 22030Γ(i+5.16)/Γ(i+7.43)
Figure 11
Fit of empirical domain family size distributions to the second-order balanced linear BDIM: the hyperthermophilic bacterium Thermotoga maritima. The panels and the designations are as in Fig. 6. B. Magenta line: f i = 4256Γ(i+0.14)/Γ(i+3.22)
Figure 12
Fit of empirical domain family size distributions to the second-order balanced linear BDIM: the thermophilic euryarchaeon Methanothermobacter thermautotrophicus. The panels and the designations are as in Fig. 6. B. Magenta line: f i = 2753Γ(i+0.12)/Γ(i+3.00)
Figure 13
Fit of empirical domain family size distributions to the second-order balanced linear BDIM: the hyperthermophilic crenarchaeon Sulfolobus solfataricus. The panels and the designations are as in Fig. 6. B. Magenta line: f i = 2714Γ(i+0.36)/Γ(i+3.04)
Figure 14
Fit of empirical domain family size distributions to the second-order balanced linear BDIM: the bacterium Bacillus subtilis. The panels and the designations are as in Fig. 6. B. Magenta line: f i = 3489Γ(i+0.48)/Γ(i+3.01)
Figure 15
Fit of empirical domain family size distributions to the second-order balanced linear BDIM: the bacterium Escherichia coli. The panels and the designations are as in Fig. 6. B. Magenta line: f i = 6776Γ(i+0.84)/Γ(i+3.54)
Figure 16
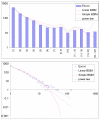
Comparison of different approximations of the empirical domain family size distribution: Escherichia coli. Magenta line: second-order balanced linear BDIM, f i = 6776Γ(i+0.84)/Γ(i+3.54), Red line: simple BDIM, f i = 528 × 0.87_i_/i, Cyan line: power law, f i = 602_i_-1.76.
Figure 17
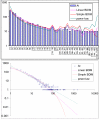
Comparison of different approximations of the empirical domain family size distribution: Arabidopsis thaliana. Magenta line: second-order balanced linear BDIM, f i = 10750Γ(i+3.80)/Γ(i+5.98), Red line: simple BDIM, f i = 344 × 0.98_i_/i, Cyan line: power law, f i = 516_i_-1.36.
Similar articles
- Simple stochastic birth and death models of genome evolution: was there enough time for us to evolve?
Karev GP, Wolf YI, Koonin EV. Karev GP, et al. Bioinformatics. 2003 Oct 12;19(15):1889-900. doi: 10.1093/bioinformatics/btg351. Bioinformatics. 2003. PMID: 14555621 - Gene family evolution: an in-depth theoretical and simulation analysis of non-linear birth-death-innovation models.
Karev GP, Wolf YI, Berezovskaya FS, Koonin EV. Karev GP, et al. BMC Evol Biol. 2004 Sep 9;4:32. doi: 10.1186/1471-2148-4-32. BMC Evol Biol. 2004. PMID: 15357876 Free PMC article. - Modeling genome evolution with a diffusion approximation of a birth-and-death process.
Karev GP, Berezovskaya FS, Koonin EV. Karev GP, et al. Bioinformatics. 2005 Nov 1;21 Suppl 3:iii12-9. doi: 10.1093/bioinformatics/bti1202. Bioinformatics. 2005. PMID: 16306387 - Biological applications of the theory of birth-and-death processes.
Novozhilov AS, Karev GP, Koonin EV. Novozhilov AS, et al. Brief Bioinform. 2006 Mar;7(1):70-85. doi: 10.1093/bib/bbk006. Brief Bioinform. 2006. PMID: 16761366 Review. - Birth and death of duplicated genes in completely sequenced eukaryotes.
Wagner A. Wagner A. Trends Genet. 2001 May;17(5):237-9. doi: 10.1016/s0168-9525(01)02243-0. Trends Genet. 2001. PMID: 11335019 Review.
Cited by
- Angiosperm-Wide and Family-Level Analyses of AP2/ERF Genes Reveal Differential Retention and Sequence Divergence After Whole-Genome Duplication.
Wang L, Ma H, Lin J. Wang L, et al. Front Plant Sci. 2019 Feb 26;10:196. doi: 10.3389/fpls.2019.00196. eCollection 2019. Front Plant Sci. 2019. PMID: 30863419 Free PMC article. - Relationship between gene duplicability and diversifiability in the topology of biochemical networks.
Guo Z, Jiang W, Lages N, Borcherds W, Wang D. Guo Z, et al. BMC Genomics. 2014 Jul 8;15(1):577. doi: 10.1186/1471-2164-15-577. BMC Genomics. 2014. PMID: 25005725 Free PMC article. - A census of membrane-bound and intracellular signal transduction proteins in bacteria: bacterial IQ, extroverts and introverts.
Galperin MY. Galperin MY. BMC Microbiol. 2005 Jun 14;5:35. doi: 10.1186/1471-2180-5-35. BMC Microbiol. 2005. PMID: 15955239 Free PMC article. Review. - Constraints and plasticity in genome and molecular-phenome evolution.
Koonin EV, Wolf YI. Koonin EV, et al. Nat Rev Genet. 2010 Jul;11(7):487-98. doi: 10.1038/nrg2810. Nat Rev Genet. 2010. PMID: 20548290 Free PMC article. Review. - Global organization of a binding site network gives insight into evolution and structure-function relationships of proteins.
Lee J, Konc J, Janežič D, Brooks BR. Lee J, et al. Sci Rep. 2017 Sep 14;7(1):11652. doi: 10.1038/s41598-017-10412-z. Sci Rep. 2017. PMID: 28912495 Free PMC article.
References
- Koonin EV, Aravind L, Kondrashov AS. The impact of comparative genomics on our understanding of evolution. Cell. 2000;101:573–576. - PubMed
- Lander ES, Linton LM, Birren B, Nusbaum C, Zody MC, Baldwin J, Devon K, Dewar K, Doyle M, FitzHugh W, Funke R, Gage D, Harris K, Heaford A, Howland J, Kann L, Lehoczky J, LeVine R, McEwan P, McKernan K, Meldrim J, Mesirov JP, Miranda C, Morris W, Naylor J, Raymond C, Rosetti M, Santos R, Sheridan A, Sougnez C, Stange-Thomann N, Stojanovic N, Subramanian A, Wyman D, Rogers J, Sulston J, Ainscough R, Beck S, Bentley D, Burton J, Clee C, Carter N, Coulson A, Deadman R, Deloukas P, Dunham A, Dunham I, Durbin R, French L, Grafham D, Gregory S, Hubbard T, Humphray S, Hunt A, Jones M, Lloyd C, McMurray A, Matthews L, Mercer S, Milne S, Mullikin JC, Mungall A, Plumb R, Ross M, Shownkeen R, Sims S, Waterston RH, Wilson RK, Hillier LW, McPherson JD, Marra MA, Mardis ER, Fulton LA, Chinwalla AT, Pepin KH, Gish WR, Chissoe SL, Wendl MC, Delehaunty KD, Miner TL, Delehaunty A, Kramer JB, Cook LL, Fulton RS, Johnson DL, Minx PJ, Clifton SW, Hawkins T, Branscomb E, Predki P, Richardson P, Wenning S, Slezak T, Doggett N, Cheng JF, Olsen A, Lucas S, Elkin C, Uberbacher E, Frazier M, et al. Initial sequencing and analysis of the human genome. Nature. 2001;409:860–921. doi: 10.1038/35057062. - DOI - PubMed
- Dacks JB, Doolittle WF. Reconstructing/deconstructing the earliest eukaryotes: how comparative genomics can help. Cell. 2001;107:419–425. - PubMed
- Chervitz SA, Aravind L, Sherlock G, Ball CA, Koonin EV, Dwight SS, Harris MA, Dolinski K, Mohr S, Smith T, Weng S, Cherry JM, Botstein D. Comparison of the complete protein sets of worm and yeast: orthology and divergence. Science. 1998;282:2022–2028. doi: 10.1126/science.282.5396.2022. - DOI - PMC - PubMed
- Rubin GM, Yandell MD, Wortman JR, Gabor Miklos GL, Nelson CR, Hariharan IK, Fortini ME, Li PW, Apweiler R, Fleischmann W, Cherry JM, Henikoff S, Skupski MP, Misra S, Ashburner M, Birney E, Boguski MS, Brody T, Brokstein P, Celniker SE, Chervitz SA, Coates D, Cravchik A, Gabrielian A, Galle RF, Gelbart WM, George RA, Goldstein LS, Gong F, Guan P, Harris NL, Hay BA, Hoskins RA, Li J, Li Z, Hynes RO, Jones SJ, Kuehl PM, Lemaitre B, Littleton JT, Morrison DK, Mungall C, O'Farrell PH, Pickeral OK, Shue C, Vosshall LB, Zhang J, Zhao Q, Zheng XH, Zhong F, Zhong W, Gibbs R, Venter JC, Adams MD, Lewis S. Comparative genomics of the eukaryotes. Science. 2000;287:2204–2215. doi: 10.1126/science.287.5461.2204. - DOI - PMC - PubMed
MeSH terms
LinkOut - more resources
Full Text Sources


