Expanding protein universe and its origin from the biological Big Bang - PubMed (original) (raw)
Expanding protein universe and its origin from the biological Big Bang
Nikolay V Dokholyan et al. Proc Natl Acad Sci U S A. 2002.
Abstract
The bottom-up approach to understanding the evolution of organisms is by studying molecular evolution. With the large number of protein structures identified in the past decades, we have discovered peculiar patterns that nature imprints on protein structural space in the course of evolution. In particular, we have discovered that the universe of protein structures is organized hierarchically into a scale-free network. By understanding the cause of these patterns, we attempt to glance at the very origin of life.
Figures
Fig 1.
An example of a large cluster of TIM barrel-fold protein domains. Protein domains whose DALI similarity Z score is greater than Zmin = 9 are connected by lines.
Fig 2.
The dependence of the number of proteins in the maximal cluster on the threshold value of Z score Zmin for PDUG (a) and random graphs (b). (c) The probability density of the cluster sizes for PDUG and random graphs at their respective Zc. Zc indicates the critical value of the Z score threshold at which transition in the size of maximal cluster occurs. For PDUG Zc ≈ 9; for random graphs Zc ≈ 11. We generated 10 different realizations of random graphs, so each point of b represents an average over these 10 realizations. Interestingly, at minimal Zmin = 2, all of the nodes in random graphs are connected; thus, the largest cluster spans all of the protein domains. In contrast, just a small fraction of all nodes (≈250) constitutes the largest cluster in PDUG (at Zmin = 2), pointing to a dramatic difference between PDUG and random graphs. This difference is further revealed in Fig. 3.
Fig 3.
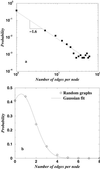
The distribution of node connectivity 𝒫(k) for PDUG (a) and for random graph (b) at their corresponding Zc. For PDUG Zc ≈ 9; for random graphs Zc ≈ 11. Node connectivity denotes how many proteins a given protein is connected to by structural similarity connections.
Fig 4.
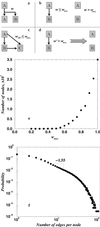
Proposed model of domain evolution. (a) Gene duplication (A → A + B): the structural similarity between A and B is defined by some function w = (A,B) (e.g., RMSD or DRMSD). (b) If structural similarity w = (A,B) is greater than some critical value w max, then we add a link connecting A and B. If structural similarity is above w max, a new fold family is born. (c) The second generation progeny C (A → B → C) can connect to its grandparent A, if there is structural similarity between A and C: w AC ≤ w max. (d) With each time step, mutations diverge protein structures from each other; i.e., structural similarity changes by some value D: w → _w_′ = w + D(D = 10−4). If _w_′ > w max, we remove the edge between corresponding proteins. (e) The dependence of the size of the largest cluster in the graphs generated by our model on wmax, averaged over 20 realizations. (f) The probability of the node connectivity in our model, averaged over 102 realizations. Apart from the finite-size effects at large k, it exhibits power law distribution with exponent α ≈ 1.6.
Similar articles
- The architecture of the protein domain universe.
Dokholyan NV. Dokholyan NV. Gene. 2005 Mar 14;347(2):199-206. doi: 10.1016/j.gene.2004.12.020. Epub 2005 Feb 24. Gene. 2005. PMID: 15777630 - Protostar formation in the early universe.
Yoshida N, Omukai K, Hernquist L. Yoshida N, et al. Science. 2008 Aug 1;321(5889):669-71. doi: 10.1126/science.1160259. Science. 2008. PMID: 18669856 - Loops and repeats in proteins as footprints of molecular evolution.
Deryusheva EI, Selivanova OM, Serdyuk IN. Deryusheva EI, et al. Biochemistry (Mosc). 2012 Dec;77(13):1487-99. doi: 10.1134/S000629791213007X. Biochemistry (Mosc). 2012. PMID: 23379524 Review. - On the origin and highly likely completeness of single-domain protein structures.
Zhang Y, Hubner IA, Arakaki AK, Shakhnovich E, Skolnick J. Zhang Y, et al. Proc Natl Acad Sci U S A. 2006 Feb 21;103(8):2605-10. doi: 10.1073/pnas.0509379103. Epub 2006 Feb 14. Proc Natl Acad Sci U S A. 2006. PMID: 16478803 Free PMC article. - The structure of the protein universe and genome evolution.
Koonin EV, Wolf YI, Karev GP. Koonin EV, et al. Nature. 2002 Nov 14;420(6912):218-23. doi: 10.1038/nature01256. Nature. 2002. PMID: 12432406 Review.
Cited by
- Phylogeny of Toll-like receptor signaling: adapting the innate response.
Roach JM, Racioppi L, Jones CD, Masci AM. Roach JM, et al. PLoS One. 2013;8(1):e54156. doi: 10.1371/journal.pone.0054156. Epub 2013 Jan 11. PLoS One. 2013. PMID: 23326591 Free PMC article. - Structural diversity of protein segments follows a power-law distribution.
Sawada Y, Honda S. Sawada Y, et al. Biophys J. 2006 Aug 15;91(4):1213-23. doi: 10.1529/biophysj.105.076661. Epub 2006 May 26. Biophys J. 2006. PMID: 16731566 Free PMC article. - Graph-representation of oxidative folding pathways.
Agoston V, Cemazar M, Kaján L, Pongor S. Agoston V, et al. BMC Bioinformatics. 2005 Jan 27;6:19. doi: 10.1186/1471-2105-6-19. BMC Bioinformatics. 2005. PMID: 15676070 Free PMC article. - Thermodynamic stability of histone H3 is a necessary but not sufficient driving force for its evolutionary conservation.
Ramachandran S, Vogel L, Strahl BD, Dokholyan NV. Ramachandran S, et al. PLoS Comput Biol. 2011 Jan 6;7(1):e1001042. doi: 10.1371/journal.pcbi.1001042. PLoS Comput Biol. 2011. PMID: 21253558 Free PMC article. - Stylus: a system for evolutionary experimentation based on a protein/proteome model with non-arbitrary functional constraints.
Axe DD, Dixon BW, Lu P. Axe DD, et al. PLoS One. 2008 Jun 4;3(6):e2246. doi: 10.1371/journal.pone.0002246. PLoS One. 2008. PMID: 18523658 Free PMC article.
References
- Rost B. (1997) Folding Des. 2, S19-S24. - PubMed
- Holm L. & Sander, C. (1993) J. Mol. Biol. 233, 123-138. - PubMed
- Holm L. & Sander, C. (1997) Proteins 28, 72-82. - PubMed
- Dokholyan N. V. & Shakhnovich, E. I. (2001) J. Mol. Biol. 312, 289-307. - PubMed
- Shakhnovich E. I. (1998) Folding Des. 3, R45-R58. - PubMed
Publication types
MeSH terms
Substances
Grants and funding
- R01 GM052126/GM/NIGMS NIH HHS/United States
- GM52126/GM/NIGMS NIH HHS/United States
- GM20251/GM/NIGMS NIH HHS/United States
- R56 GM052126/GM/NIGMS NIH HHS/United States
- F32 GM020251/GM/NIGMS NIH HHS/United States
LinkOut - more resources
Full Text Sources
Miscellaneous


