Placement of the structural proteins in Sindbis virus - PubMed (original) (raw)
Placement of the structural proteins in Sindbis virus
Wei Zhang et al. J Virol. 2002 Nov.
Abstract
The structure of the lipid-enveloped Sindbis virus has been determined by fitting atomic resolution crystallographic structures of component proteins into an 11-A resolution cryoelectron microscopy map. The virus has T=4 quasisymmetry elements that are accurately maintained between the external glycoproteins, the transmembrane helical region, and the internal nucleocapsid core. The crystal structure of the E1 glycoprotein was fitted into the cryoelectron microscopy density, in part by using the known carbohydrate positions as restraints. A difference map showed that the E2 glycoprotein was shaped similarly to E1, suggesting a possible common evolutionary origin for these two glycoproteins. The structure shows that the E2 glycoprotein would have to move away from the center of the trimeric spike in order to expose enough viral membrane surface to permit fusion with the cellular membrane during the initial stages of host infection. The well-resolved E1-E2 transmembrane regions form alpha-helical coiled coils that were consistent with T=4 symmetry. The known structure of the capsid protein was fitted into the density corresponding to the nucleocapsid, revising the structure published earlier.
Figures
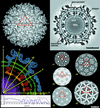
FIG. 1.
CryoEM density distribution for Sindbis virus. Top left, surface of the virus at 20-Å resolution. The red triangle marks the boundary of an icosahedral asymmetric unit. The numbers show the positions of icosahedral two-, three-, and fivefold axes limiting the asymmetric unit. Note that there is one trimeric spike associated with an icosahedral threefold axis plus a second trimeric spike in a general position in the icosahedral asymmetric unit. Top right, cross section through the 11-Å map along the black line shown in the top left and bottom right panels. Note the clearly defined lipid bilayer and the transmembrane domains crossing the membrane. The nucleocapsid (NCP) is seen inside the membrane. Bottom left, a central cross-section through the 11-Å resolution map, showing the glycoproteins (blue), the lipid bilayer (green), the nucleocapsid (red), the mixed RNA-protein region (orange), and the internal RNA (magenta). The orientation of the icosahedral (two-, three-, and fivefold) as well as quasi-threefold (q3) axes is shown in yellow. Below the cross section is shown the radially averaged mean density (blue) and the root mean square deviation of the density from the mean (magenta). Right bottom are radial sections, for the 11-Å resolution map, at r1 = 199 Å (nucleocapsid core), r2 = 243 Å (transmembrane), r3 = 261 Å (base of the glycoproteins), r4 = 298 Å (includes the base of the spike), and r5 = 324 Å (leaf-like structure of E2) with grey scale used to denote density levels, black being the highest density. Note the _T_=4 organization of the transmembrane region in r2 and r3.
FIG. 2.
Comparison of the backbone structures of Semliki Forest virus (SFV) E1 with tick-borne encephalitis virus (TBEV) E. (A) Ribbon diagrams, with domain I in red, domain II in yellow, fusion peptides in green, and domain III in blue. (B) Stereodiagram showing superposition of Semliki Forest virus E1 (blue) on tick-borne encephalitis virus E (red). (C) Alignment of Sindbis virus (SINV) and Semliki Forest virus E1 with tick-borne encephalitis virus E, based on the structural superposition of Semliki Forest virus E1 on tick-borne encephalitis virus E. Residues of tick-borne encephalitis virus E that do not match the structure of Semliki Forest virus E1 have been omitted. Residues in domains I, II, and III are colored red, yellow, and blue, respectively, consistent with the coloring scheme used above and throughout. Shown is the complete amino acid sequence of Sindbis virus and just those residues of tick-borne encephalitis virus that could be structurally aligned with Semliki Forest virus E1. Sequences underlined with a solid bar are β-strands, and those underlined with dashed bars are α-helices. Secondary structural nomenclature is taken from Rey et al. (39).
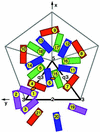
FIG. 3.
_T_=4 quasi-symmetry generation depicted diagrammatically in terms of the E1 glycoprotein. E1 molecules related by icosahedral symmetry are all of the same color (purple, red, blue, or green). Quasi-symmetry operators relate molecules of different color. The initial molecule is placed in position 1. The adjacent icosahedral threefold axis (marked by a 3) then generates molecules 2 and 3, and the adjacent quasi-twofold axis (marked by an orange oval) generates molecule 4. A quasi-threefold axis (marked by q3) generates molecules 5 and 6 from molecule 4. Subsequently, the icosahedral fivefold axis (marked by a 5) generates molecules 7 through 18 from molecules 4, 5, and 6, and the icosahedral twofold axis (marked by a 2) generates molecules 19, 20, and 21 from molecules 1, 5, and 7, respectively. Note that molecules 1, 5, 7, 19, 20, and 21 form a hexamer and molecules 6, 15, 16, 17, and 18 form a pentamer, as in the nucleocapsid. The thick black outlined triangle marks one of the 60 icosahedral asymmetric units.
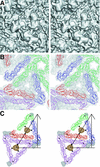
FIG. 4.
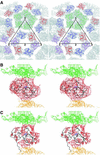
Stereodiagrams showing the glycoproteins E1 and E2. (A) Surface-shaded representation of the E1-E2 glycoprotein spike at the quasi-threefold axis. Note the pore at the center of the spike, consistent with the results of Parades et al. (34). (B) Fit of E1 monomer Cα backbone into density (top view) around the quasi-threefold axis, viewed as in A. The molecules, represented by their Cα backbone, are colored as in Fig. 3. The cryoEM density is grey. (C) E1 i3 and q3 trimers (top view), color coded and oriented as in Fig. 3. Part of the triangular icosahedral asymmetric unit is outlined. The E1 carbohydrate difference densities (139 grey, 245 brown) are also shown, as well as their corresponding Cα atoms (black circle for 139 and black dot for 245). (D) Heterodimer showing the E1 structure and the E2 difference density (side view). The density corresponding to the lipid bilayer is shown in green. (E) The E2 difference density for molecule 5 (purple) fitted with the E1 Cα backbone (black). Note the central hole in the E2 density visible in the mauve orientation, probably as a result of an α-helix. (F) E2 difference density (side view) around a q3 axis colored blue (molecule 4), mauve (molecule 5), and brown (molecule 6). The E2 carbohydrate difference densities (196 mauve, 318 red) are also shown. The lipid bilayer density is shown in green. The fitted E1 molecules are shown as their Cα backbones, colored as in Fig. 3.
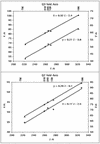
FIG. 5.
Plots of x and y versus z, representing the trace of the quasi-threefold and quasi-twofold axes provided by the positions of the carbohydrate and transmembrane sites. Coordinates are for the mass center of sets of three (tracing the quasi-threefold axis) and two (tracing the quasi-twofold axis) carbohydrate sites and the transmembrane region. Equations for the least-squares fitted lines are shown. The appropriate Sindbis virus carbohydrate sites (318, 245, 139, and 196) and transmembrane site are shown at the top.
FIG. 6.
(A) Side view of one of the four _T_=4 related transmembrane regions fitted with a 28-residue coiled-coil segment derived from the GCN4 structure (Cα, trunc, in Table 1). (B) Sequence of the E1 and E2 glycoproteins fitted to the A and B chains of GCN4, respectively. Ectodomain residues are in blue, residues in phospholipid leaflets are in green, residues in the aliphatic center of the membrane are in yellow, cytoplasmic residues are in red, and residues that bind to capsid protein (CP) are in black.
FIG. 7.
Fit of the capsid protein (CP) crystal structure into the cryoEM map. (A) Top view, showing the hexamer and pentamer around an icosahedral twofold axis and a fivefold axis, respectively. Molecules are colored as in Fig. 3. The electron density is colored grey. (B) Side view of one capsid protein crystal structure (black) fitted into the cryoEM density. The membrane density is colored green. Tyr180 in the peptide binding pocket is shown in blue. (C) CryoEM difference density after subtracting the density due to the capsid protein. Note that the amino-terminal residues 106 to 114 are out of density but that there is an obvious density region where these residues are positioned in the virus as opposed to the crystal structure. This density leads from the mixed protein-RNA region into the capsid protein shell.
Similar articles
- Mapping the structure and function of the E1 and E2 glycoproteins in alphaviruses.
Mukhopadhyay S, Zhang W, Gabler S, Chipman PR, Strauss EG, Strauss JH, Baker TS, Kuhn RJ, Rossmann MG. Mukhopadhyay S, et al. Structure. 2006 Jan;14(1):63-73. doi: 10.1016/j.str.2005.07.025. Structure. 2006. PMID: 16407066 Free PMC article. - Structural changes of envelope proteins during alphavirus fusion.
Li L, Jose J, Xiang Y, Kuhn RJ, Rossmann MG. Li L, et al. Nature. 2010 Dec 2;468(7324):705-8. doi: 10.1038/nature09546. Nature. 2010. PMID: 21124457 Free PMC article. - Locations of carbohydrate sites on alphavirus glycoproteins show that E1 forms an icosahedral scaffold.
Pletnev SV, Zhang W, Mukhopadhyay S, Fisher BR, Hernandez R, Brown DT, Baker TS, Rossmann MG, Kuhn RJ. Pletnev SV, et al. Cell. 2001 Apr 6;105(1):127-136. doi: 10.1016/s0092-8674(01)00302-6. Cell. 2001. PMID: 11301008 Free PMC article. - Molecular pathogenesis of Sindbis virus encephalitis in experimental animals.
Griffin DE. Griffin DE. Adv Virus Res. 1989;36:255-71. doi: 10.1016/s0065-3527(08)60587-4. Adv Virus Res. 1989. PMID: 2544083 Review. - Budding of alphaviruses.
Garoff H, Sjöberg M, Cheng RH. Garoff H, et al. Virus Res. 2004 Dec;106(2):103-16. doi: 10.1016/j.virusres.2004.08.008. Virus Res. 2004. PMID: 15567491 Review.
Cited by
- Cryo-EM structure of the mature and infective Mayaro virus at 4.4 Å resolution reveals features of arthritogenic alphaviruses.
Ribeiro-Filho HV, Coimbra LD, Cassago A, Rocha RPF, Guerra JVDS, de Felicio R, Carnieli CM, Leme L, Padilha AC, Paes Leme AF, Trivella DBB, Portugal RV, Lopes-de-Oliveira PS, Marques RE. Ribeiro-Filho HV, et al. Nat Commun. 2021 May 24;12(1):3038. doi: 10.1038/s41467-021-23400-9. Nat Commun. 2021. PMID: 34031424 Free PMC article. - Characterization of an early-stage fusion intermediate of Sindbis virus using cryoelectron microscopy.
Cao S, Zhang W. Cao S, et al. Proc Natl Acad Sci U S A. 2013 Aug 13;110(33):13362-7. doi: 10.1073/pnas.1301911110. Epub 2013 Jul 29. Proc Natl Acad Sci U S A. 2013. PMID: 23898184 Free PMC article. - Sample preparation induced artifacts in cryo-electron tomographs.
Plevka P, Battisti AJ, Winkler DC, Tars K, Holdaway HA, Bator CM, Rossmann MG. Plevka P, et al. Microsc Microanal. 2012 Oct;18(5):1043-8. doi: 10.1017/S1431927612001298. Epub 2012 Oct 8. Microsc Microanal. 2012. PMID: 23040048 Free PMC article. - Grass carp reovirus VP56 and VP35 induce formation of viral inclusion bodies for replication.
Zhang C, Wu H, Feng H, Zhang YA, Tu J. Zhang C, et al. iScience. 2023 Dec 7;27(1):108684. doi: 10.1016/j.isci.2023.108684. eCollection 2024 Jan 19. iScience. 2023. PMID: 38188516 Free PMC article. - Structure of immature West Nile virus.
Zhang Y, Kaufmann B, Chipman PR, Kuhn RJ, Rossmann MG. Zhang Y, et al. J Virol. 2007 Jun;81(11):6141-5. doi: 10.1128/JVI.00037-07. Epub 2007 Mar 21. J Virol. 2007. PMID: 17376919 Free PMC article.
References
- Baker, T. S., and R. H. Cheng. 1996. A model-based approach for determining orientations of biological macromolecules imaged by cryoelectron microscopy. J. Struct. Biol. 116:120-130. - PubMed
- Bashton, M., and C. Chothia. 2002. The geometry of domain combination in proteins. J. Mol. Biol. 315:927-939. - PubMed
Publication types
MeSH terms
Substances
Grants and funding
- R37 GM033050/GM/NIGMS NIH HHS/United States
- R01 GM033050/GM/NIGMS NIH HHS/United States
- AI45976/AI/NIAID NIH HHS/United States
- GM5627/GM/NIGMS NIH HHS/United States
- P01 AI045976/AI/NIAID NIH HHS/United States
- GM33050/GM/NIGMS NIH HHS/United States
LinkOut - more resources
Full Text Sources
Other Literature Sources
Molecular Biology Databases
