Mad2 and BubR1 function in a single checkpoint pathway that responds to a loss of tension - PubMed (original) (raw)
Mad2 and BubR1 function in a single checkpoint pathway that responds to a loss of tension
Katie B Shannon et al. Mol Biol Cell. 2002 Oct.
Abstract
The spindle checkpoint monitors microtubule attachment and tension at kinetochores to ensure proper chromosome segregation. Previously, PtK1 cells in hypothermic conditions (23 degrees C) were shown to have a pronounced mitotic delay, despite having normal numbers of kinetochore microtubules. At 23 degrees C, we found that PtK1 cells remained in metaphase for an average of 101 min, compared with 21 min for cells at 37 degrees C. The metaphase delay at 23 degrees C was abrogated by injection of Mad2 inhibitors, showing that Mad2 and the spindle checkpoint were responsible for the prolonged metaphase. Live cell imaging showed that kinetochore Mad2 became undetectable soon after chromosome congression. Measurements of the stretch between sister kinetochores at metaphase found a 24% decrease in tension at 23 degrees C, and metaphase kinetochores at 23 degrees C exhibited higher levels of 3F3/2, Bub1, and BubR1 compared with 37 degrees C. Microinjection of anti-BubR1 antibody abolished the metaphase delay at 23 degrees C, indicating that the higher kinetochore levels of BubR1 may contribute to the delay. Disrupting both Mad2 and BubR1 function induced anaphase with the same timing as single inhibitions, suggesting that these checkpoint genes function in the same pathway. We conclude that reduced tension at kinetochores with a full complement of kinetochore microtubules induces a checkpoint dependent metaphase delay associated with elevated amounts of kinetochore 3F3/2, Bub1, and BubR1 labeling.
Figures
Figure 1
PtK1 cells exhibit a metaphase delay at 23°C. After an extended prometaphase, all chromosomes are aligned at the metaphase plate at 0:00:00. The cell enters anaphase after a lengthy metaphase delay. Time h:min:sec Bar, 5 μm.
Figure 2
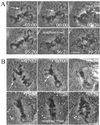
Mad2 is required for the metaphase delay at 23°C. (A) Injection of GST-Mad1F10 eliminates the metaphase delay in PtK1 cells at 23°C. After all chromosomes reached alignment at the metaphase plate (arrow), the cell was injected with GST-Mad1F10 (asterisk). The cell entered anaphase a short time later. Time is shown in minutes:seconds. Bar, 5 μm. (B) Injection of anti-Mad2 antibody eliminates the mitotic delay in PtK1 cells at 23°C. After the last chromosome reached alignment at the metaphase plate (arrow), the cell was injected with anti-Mad2 antibody (asterisk). The cell entered anaphase a short time later. Time is shown in minutes:seconds. Bar, 5 μm.
Figure 3
Fluorescent and phase-contrast time lapse images of a living mitotic PtK1 cell at 23°C injected with Alexa-488XMad2. Fluorescent XMad2 localizes to the kinetochore of the unaligned chromosome (arrow), and becomes lost as the chromosome reaches the metaphase plate. Mad2 fluorescence is also briefly visible at the proximal spindle pole (arrowhead). The cell remains in metaphase long after fluorescent Mad2 is no longer visible at the kinetochore or spindle pole. Time is shown in hours:minutes:seconds. Bar, 5 μm.
Figure 4
FRAP analysis of Mad2 turnover at kinetochores in PtK1 cells at 23°C. (A) Cells were fluorescently imaged before and after photobleaching of a single kinetochore (arrow). Arrowhead represents Mad2 at the spindle pole. Prebleach, postbleach, and recovery images are shown. Time is in minutes:seconds. (B) Corresponding FRAP graph of Mad2 turnover at the bleached kinetochore. Square represents the kinetochore, while the diamonds are measurements of background fluorescence. Arrow represents time of photobleaching.
Figure 5
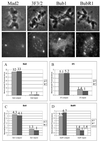
Fluorescent intensities of kinetochores at 23 and 37°C. Top panels show representative fluorescent images of PtK1 cells at 23°C stained with the antibodies indicated. (A–D) Quantitative comparison of relative changes in fluorescence. Values from Table 2 were normalized using the fluorescence at aligned kinetchores at 37°C.
Figure 6
Injection of anti-BubR1 antibody abrogates the metaphase delay in PtK1 cells at 23°C. After the last chromosome reached alignment at the metaphase plate (arrow), the cell was injected with anti-BubR1 antibody (asterisk). The cell entered anaphase a short time later. Time is shown in minutes:seconds. Bar, 5 μm.
Figure 7
Double injection of GST-Mad1F10 and anti-BubR1 antibody suggests that there is a single mitotic checkpoint pathway. After the PtK1 cell at 23°C reaches metaphase (arrow), it is injected first with GST-Mad1F10 and then with anti-BubR1 antibody (asterisks). The cell enters anaphase at 29:50. Time is shown in min:sec. Bar, 5 μm.
Figure 8
Microinjection of Mad1F10 abrogates the checkpoint in HeLa cells treated with low doses of vinblastine. HeLa cells in 6.7 nM vinblastine were injected with GST-Mad1F10 (asterisk). The cell enters C phase, then respreads and reforms nucleoli, indicating exit from mitosis. Time is shown in h:min.
Similar articles
- Microtubule-dependent changes in assembly of microtubule motor proteins and mitotic spindle checkpoint proteins at PtK1 kinetochores.
Hoffman DB, Pearson CG, Yen TJ, Howell BJ, Salmon ED. Hoffman DB, et al. Mol Biol Cell. 2001 Jul;12(7):1995-2009. doi: 10.1091/mbc.12.7.1995. Mol Biol Cell. 2001. PMID: 11451998 Free PMC article. - Different spindle checkpoint proteins monitor microtubule attachment and tension at kinetochores in Drosophila cells.
Logarinho E, Bousbaa H, Dias JM, Lopes C, Amorim I, Antunes-Martins A, Sunkel CE. Logarinho E, et al. J Cell Sci. 2004 Apr 1;117(Pt 9):1757-71. doi: 10.1242/jcs.01033. Epub 2004 Mar 16. J Cell Sci. 2004. PMID: 15075237 - BubR1 is essential for kinetochore localization of other spindle checkpoint proteins and its phosphorylation requires Mad1.
Chen RH. Chen RH. J Cell Biol. 2002 Aug 5;158(3):487-96. doi: 10.1083/jcb.200204048. Epub 2002 Aug 5. J Cell Biol. 2002. PMID: 12163471 Free PMC article. - Bub1 and BubR1: at the interface between chromosome attachment and the spindle checkpoint.
Elowe S. Elowe S. Mol Cell Biol. 2011 Aug;31(15):3085-93. doi: 10.1128/MCB.05326-11. Epub 2011 May 31. Mol Cell Biol. 2011. PMID: 21628528 Free PMC article. Review. - Linking kinetochore-microtubule binding to the spindle checkpoint.
Burke DJ, Stukenberg PT. Burke DJ, et al. Dev Cell. 2008 Apr;14(4):474-9. doi: 10.1016/j.devcel.2008.03.015. Dev Cell. 2008. PMID: 18410725 Free PMC article. Review.
Cited by
- SUMO modification of DNA topoisomerase II: trying to get a CENse of it all.
Lee MT, Bachant J. Lee MT, et al. DNA Repair (Amst). 2009 Apr 5;8(4):557-68. doi: 10.1016/j.dnarep.2009.01.004. Epub 2009 Feb 20. DNA Repair (Amst). 2009. PMID: 19230795 Free PMC article. Review. - Smurf2 as a novel mitotic regulator: From the spindle assembly checkpoint to tumorigenesis.
Osmundson EC, Ray D, Moore FE, Kiyokawa H. Osmundson EC, et al. Cell Div. 2009 Jul 7;4:14. doi: 10.1186/1747-1028-4-14. Cell Div. 2009. PMID: 19583833 Free PMC article. - The chromosomal passenger complex and the spindle assembly checkpoint: kinetochore-microtubule error correction and beyond.
Vader G, Maia AF, Lens SM. Vader G, et al. Cell Div. 2008 May 28;3:10. doi: 10.1186/1747-1028-3-10. Cell Div. 2008. PMID: 18507820 Free PMC article. - Oxidative Stress Delays Prometaphase/Metaphase of the First Cleavage in Mouse Zygotes via the MAD2L1-Mediated Spindle Assembly Checkpoint.
Wu Q, Li Z, Huang Y, Qian D, Chen M, Xiao W, Wang B. Wu Q, et al. Oxid Med Cell Longev. 2017;2017:2103190. doi: 10.1155/2017/2103190. Epub 2017 Sep 25. Oxid Med Cell Longev. 2017. PMID: 29147457 Free PMC article. - NEK2 induces drug resistance mainly through activation of efflux drug pumps and is associated with poor prognosis in myeloma and other cancers.
Zhou W, Yang Y, Xia J, Wang H, Salama ME, Xiong W, Xu H, Shetty S, Chen T, Zeng Z, Shi L, Zangari M, Miles R, Bearss D, Tricot G, Zhan F. Zhou W, et al. Cancer Cell. 2013 Jan 14;23(1):48-62. doi: 10.1016/j.ccr.2012.12.001. Cancer Cell. 2013. PMID: 23328480 Free PMC article.
References
- Amon A. The spindle checkpoint. Curr Opin Genet Dev. 1999;9:69–75. - PubMed
- Campbell MS, Daum JR, Gersch MS, Nicklas RB, Gorbsky GJ. Kinetochore “memory” of spindle checkpoint signaling in lysed mitotic cells. Cell Motil Cytoskelet. 2000;46:146–156. - PubMed
- Canman J, Salmon E, Fang G. Inducing precocious anaphase in cultured mammalian cells. Cell Motil Cytoskelet. 2002a;52:61–65. - PubMed
- Canman JC, Hoffman DB, Salmon ED. The role of pre- and post-anaphase microtubules in the cytokinesis phase of the cell cycle. Curr Biol. 2000;10:611–614. - PubMed
Publication types
MeSH terms
Substances
Grants and funding
- GM000678/GM/NIGMS NIH HHS/United States
- K12 GM000678/GM/NIGMS NIH HHS/United States
- R37 GM024364/GM/NIGMS NIH HHS/United States
- R01 GM024364/GM/NIGMS NIH HHS/United States
- GM24364/GM/NIGMS NIH HHS/United States
LinkOut - more resources
Full Text Sources
Other Literature Sources
Miscellaneous


