Coupling between voltage sensors and activation gate in voltage-gated K+ channels - PubMed (original) (raw)
Coupling between voltage sensors and activation gate in voltage-gated K+ channels
Zhe Lu et al. J Gen Physiol. 2002 Nov.
Abstract
Current through voltage-gated K+ channels underlies the action potential encoding the electrical signal in excitable cells. The four subunits of a voltage-gated K+ channel each have six transmembrane segments (S1-S6), whereas some other K+ channels, such as eukaryotic inward rectifier K+ channels and the prokaryotic KcsA channel, have only two transmembrane segments (M1 and M2). A voltage-gated K+ channel is formed by an ion-pore module (S5-S6, equivalent to M1-M2) and the surrounding voltage-sensing modules. The S4 segments are the primary voltage sensors while the intracellular activation gate is located near the COOH-terminal end of S6, although the coupling mechanism between them remains unknown. In the present study, we found that two short, complementary sequences in voltage-gated K+ channels are essential for coupling the voltage sensors to the intracellular activation gate. One sequence is the so called S4-S5 linker distal to the voltage-sensing S4, while the other is around the COOH-terminal end of S6, a region containing the actual gate-forming residues.
Figures
Figure 1.
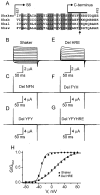
Deletions of COOH-terminal residues in Shaker. (A) Sequence alignment of S6 and initial part of the COOH terminus for four voltage-gated K+ channels (the arrow indicates the last conserved residue in the region). (B–G) Current records from oocytes injected with RNA encoding Shaker or mutants that lack the indicated residues in the region under the horizontal bar in A. Dotted lines identify the zero current level. (H) G-V curves for Shaker and the HRE deletion mutant; the data points represent mean currents (± SEM, n = 15 and 6). The fitted curves correspond to the Boltzmann function, yielding V1/2 = −32.8 ± 0.3 mV and valence (Z) = 3.9 ± 0.3 for Shaker, and V1/2 = 6.8 ± 1.3 mV (n = 6) and Z = 1.1 ± 0.1 for the HRE deletion mutant.
Figure 2.
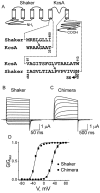
Comparison between Shaker and a Shaker-KcsA chimera. (A) Schema of the polypeptide chain topology of a Shaker-KcsA chimeric channel subunit and partial sequences of the parent channels around the splicing sites. (B–D) Currents of Shaker (B) and the chimera (C), and the corresponding G-V curves (D) where the data points represent mean currents (± SEM; n = 9 and 15). The fitted curves superimposed on the data correspond to the Boltzmann function, yielding V1/2 = −32.8 ± 0.3 mV and valence (Z) = 3.9 ± 0.3 for Shaker, and V1/2 = 30.5 ± 0.3 mV and Z = 3.0 ± 0.1 for the chimera.
Figure 3.
Shaker-KcsA chimeras with various distal junctions in S6. (A) Schema of the polypeptide chain topology of a Shaker-KcsA chimeric channel subunit and partial sequences of the parent channels around the splicing sites. All chimeras have the same proximal junction connecting Shaker's L396 to KcsA's G30 as indicated by the arrow. The distal junction is varied across the region, as pictured by the arrows, where the arrow type indicates whether a chimera expresses minimal (solid) or robust (dotted) voltage-independent conductance. (B–E) Current records of chimeric channels with the distal junction at four consecutive positions. (F) G-V curves (normalized tail currents vs. membrane voltage) for all chimeras expressing voltage-independent conductance at negative voltage. The fitted curves correspond to the Boltzmann function with an extra constant, “C,” which accounts for the voltage-independent conductance at negative voltage. (G) Values of V1/2 (mean ± SEM), Z, and C from the fits in F, where n is the number of oocytes examined. (H) The ratio (mean ± SEM, n = 5–11) of the currents at −80 and 80 mV versus the position of the distal junction in the chimeric constructs.
Figure 4.
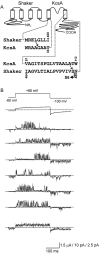
Currents of Shaker-KcsA chimeric channels recorded from a membrane patch versus a whole oocyte. (A) Schema of the polypeptide chain topology of a Shaker-KcsA chimeric channel subunit and partial sequences of the parent channels around the splicing sites. (B) Current records of the chimera. The first trace, below the voltage protocol, was recorded from a whole oocyte with a two-electrode voltage-clamp amplifier. The next six traces were recorded with a patch-clamp amplifier from a cell-attached patch, whereas the last one is the ensemble average of 50 current traces.
Figure 5.
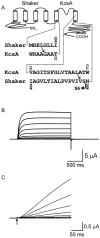
Time course of the current onset in chimeric channels. (A) Schema of the polypeptide chain topology of a Shaker-KcsA chimeric channel subunit and partial sequences of the parent channels around the splicing sites. (B) Current traces of the chimeric channels, whose initial part is shown in higher temporal resolution in C, where the beginning of the depolarization pulses is indicated by the arrow.
Figure 6.
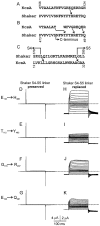
Nonfunctional Shaker-KcsA chimeras with various distal COOH-terminal junctions and their rescue by the replacement of the S4–S5 linker. (A and B) Two distinct sequence alignments between Shaker and KcsA in S6/M2-COOH terminus. The distal junction in four chimeric constructs is indicated by the arrows. (C) Alignment of Shaker's S4–S5 linker sequence and its KcsA counterpart (the arrows indicate two alternative proximal junctions). (D–K) Current records from oocytes injected with RNA encoding four chimeras with different distal junctions as indicated. Chimeras corresponding to D-G have a proximal junction that preserves Shaker's S4–S5 linker, whereas in those corresponding to H–K the Shaker S4–S5 linker is replaced by its KcsA counterpart.
Figure 7.
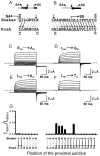
Partial and full replacements of the S4–S5 linker by the counterparts in KcsA. All chimeras have an identical distal junction between KcsA's A109 and Shaker's I477 as in Fig. 3 E. (A) Sequence alignment between Shaker's S4–S5 linker and its KcsA counterpart (the downward arrow marks the center of the sequences). (B–E) Current records from chimeras containing Shaker's S4–S5 linker (B), and whose entire linker (C), or the proximal part (D), or the distal part (E) is replaced by the KcsA counterpart as pictured.
Figure 8.
Restoration of Shaker's S4–S5 linker sequence. (A and B) Sequence alignment between Shaker's S4–S5 linker through the proximal part of S5 and the KcsA counterpart; the center of the linker is marked by the downward arrows. The arrows in A and B, respectively, indicate a systematic restoration of the Shaker sequence toward S4 and S5 from the center of the S4-S5 linker. The color and type of the arrows represent the chimeras which express minimal (solid black), robust (dotted black) voltage-independent conductance, or electrically nonfunctional chimeric constructs (gray). (C–F) Current records from chimeras with the proximal junction at four different positions. (G) The ratio (mean ± SEM, n = 5–8) of currents at −80 and 80 mV versus the position of the proximal junction in the chimeric constructs.
Figure 9.
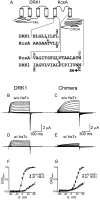
A DRK1-KcsA chimera and its HaTx sensitivity. (A) Schema of the polypeptide chain topology of a DRK1-KcsA chimeric channel subunit and partial sequences of the parent channels around the splicing sites. (B–E) Currents of DRK1 (B and D) and the chimera (C and E) without (B and C) and with (D and E) 4 μM HaTx. (F and G) G-V curves for DRK1 and the chimera with and without 4 μM HaTx; the data points represent mean currents (± SEM; n = 6–15). The fitted curves superimposed on the data without HaTx correspond to the Boltzmann function, yielding V1/2 = −0.4 ± 1.0 mV and Z = 2.5 ± 0.3 for DRK1, and V1/2 = 35.1 ± 0.4 mV and Z = 2.2 ± 0.4 for the chimera. The curves on the data with HaTx have no physical meaning.
Figure 10.
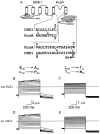
Effects of including more KcsA pore residues by moving the junctions in the DRK1-KcsA chimera proximally or distally. (A) Schema of the polypeptide chain topology of a DRK1-KcsA chimeric channel subunit and partial sequences of the parent channels around the splicing sites. The shown chimera corresponding to B and D has the same distal junction as that in Fig. 9, A and C, but a different proximal junction (solid versus dotted arrow), whereas the one corresponding to C and E has the same proximal junction as that in Fig. 9, A and C, but a different distal junction (solid vs. dotted arrows). Currents shown were recorded in either the absence (B and C) or the presence (D and E) of 4 μM HaTx.
Figure 11.
A cartoon of two Shaker subunits in the region from S4 to the initial part of the COOH terminus. Each ribbon corresponds to the structure of a KcsA subunit (Zhou et al., 2001). In each subunit, the blue region corresponds to T33 in M1 through L105 in M2, the red regions to W26-A32 in M1 and V106-T112 in M2, the green region to W113-E118 in M2, and the yellow region to Q119–A124. Each green strip represents S4 through the proximal part of the “S4–S5 linker.”
Figure 12.
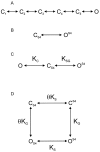
Minimal gating models. (A) A sequential model containing five closed states “C” and an open state “O”. (B) A minimal model reduced from that shown in A, where the channel is closed when the S4 is in the resting state (CS4), or open when the S4 is activated upon depolarization (OS4). (C) The minimal model shown in B with an additional transition accounting for the coupling interaction between the voltage sensors and the channel gate. It contains one closed state where the gate is coupled to the voltage sensors in the resting state (CS4), and two open states where the gate is coupled to the voltage sensors in the activated state (OS4) or it is decoupled from the sensors (O). KC is the equilibrium constant for the coupling step between the sensors and the gate, and KSG for the overall voltage sensing and gating transition. (D) A four-state allosteric model, where the voltage sensors move in the horizontal transitions, whereas the gate moves in the vertical. The gate can open with or without activating the voltage sensors (OS4 or OS4). KS and KG are, respectively, the equilibrium constants for the lower horizontal and the right vertical transitions. The coupling constant θ is defined as the ratio of the equilibrium constants either for the gating transitions without and with activating the voltage sensors, or for the voltage-sensing transitions without and with opening of the gate.
Figure 13.
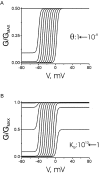
Simulations of G-V curves. (A) Simulated G-V curves with different coupling strength using equation 4, where KS = 10−9, KG = 1, and Z = 12, whereas θ is varied from 10−9 to 1 (right to left) in 10-fold increments. (B) Simulated G-V curves with the gating transition in different equilibria, where KS = 10−9, θ = 10−9, and Z = 12, whereas KG is varied from 1 to 1013 (right to left) in 10-fold increments.
Similar articles
- Molecular compatibility of the channel gate and the N terminus of S5 segment for voltage-gated channel activity.
Caprini M, Fava M, Valente P, Fernandez-Ballester G, Rapisarda C, Ferroni S, Ferrer-Montiel A. Caprini M, et al. J Biol Chem. 2005 May 6;280(18):18253-64. doi: 10.1074/jbc.M413389200. Epub 2005 Mar 4. J Biol Chem. 2005. PMID: 15749711 - The S4-S5 linker couples voltage sensing and activation of pacemaker channels.
Chen J, Mitcheson JS, Tristani-Firouzi M, Lin M, Sanguinetti MC. Chen J, et al. Proc Natl Acad Sci U S A. 2001 Sep 25;98(20):11277-82. doi: 10.1073/pnas.201250598. Epub 2001 Sep 11. Proc Natl Acad Sci U S A. 2001. PMID: 11553787 Free PMC article. - Voltage-dependent gating of hyperpolarization-activated, cyclic nucleotide-gated pacemaker channels: molecular coupling between the S4-S5 and C-linkers.
Decher N, Chen J, Sanguinetti MC. Decher N, et al. J Biol Chem. 2004 Apr 2;279(14):13859-65. doi: 10.1074/jbc.M313704200. Epub 2004 Jan 15. J Biol Chem. 2004. PMID: 14726518 - Structural organization of the voltage sensor in voltage-dependent potassium channels.
Papazian DM, Silverman WR, Lin MC, Tiwari-Woodruff SK, Tang CY. Papazian DM, et al. Novartis Found Symp. 2002;245:178-90; discussion 190-2, 261-4. Novartis Found Symp. 2002. PMID: 12027007 Review. - Molecular determinants of ion conduction and inactivation in K+ channels.
Kukuljan M, Labarca P, Latorre R. Kukuljan M, et al. Am J Physiol. 1995 Mar;268(3 Pt 1):C535-56. doi: 10.1152/ajpcell.1995.268.3.C535. Am J Physiol. 1995. PMID: 7900763 Review.
Cited by
- Opposite Effects of the S4-S5 Linker and PIP(2) on Voltage-Gated Channel Function: KCNQ1/KCNE1 and Other Channels.
Choveau FS, Abderemane-Ali F, Coyan FC, Es-Salah-Lamoureux Z, Baró I, Loussouarn G. Choveau FS, et al. Front Pharmacol. 2012 Jul 5;3:125. doi: 10.3389/fphar.2012.00125. eCollection 2012. Front Pharmacol. 2012. PMID: 22787448 Free PMC article. - Insight into the modulation of Shaw2 Kv channels by general anesthetics: structural and functional studies of S4-S5 linker and S6 C-terminal peptides in micelles by NMR.
Zhang J, Qu X, Covarrubias M, Germann MW. Zhang J, et al. Biochim Biophys Acta. 2013 Feb;1828(2):595-601. doi: 10.1016/j.bbamem.2012.09.025. Epub 2012 Sep 29. Biochim Biophys Acta. 2013. PMID: 23031574 Free PMC article. - Transfer of Kv3.1 voltage sensor features to the isolated Ci-VSP voltage-sensing domain.
Mishina Y, Mutoh H, Knöpfel T. Mishina Y, et al. Biophys J. 2012 Aug 22;103(4):669-76. doi: 10.1016/j.bpj.2012.07.031. Biophys J. 2012. PMID: 22947928 Free PMC article. - hERG Function in Light of Structure.
Robertson GA, Morais-Cabral JH. Robertson GA, et al. Biophys J. 2020 Feb 25;118(4):790-797. doi: 10.1016/j.bpj.2019.10.010. Epub 2019 Oct 18. Biophys J. 2020. PMID: 31669064 Free PMC article. Review. - Mg2+ enhances voltage sensor/gate coupling in BK channels.
Horrigan FT, Ma Z. Horrigan FT, et al. J Gen Physiol. 2008 Jan;131(1):13-32. doi: 10.1085/jgp.200709877. J Gen Physiol. 2008. PMID: 18166624 Free PMC article.
References
- Aggarwal, S.K. 1996. Analysis of the voltage-sensor in a voltage-activated potassium channel. Ph.D. thesis. Harvard University, Cambridge, MA.
- Aggarwal, S.K., and R. MacKinnon. 1996. Contribution of the S4 segment to gating charge in the Shaker K+ channel. Neuron. 16:1169–1177. - PubMed
- Caprini, M., S. Ferroni, R. Planells-Cases, J. Rueda, C. Rapisarda, A. Ferrer-Montiel, and M. Montal. 2001. Structural compatibility between the putative voltage sensor of voltage-gated K+ channels and the prokaryotic KcsA channel. J. Biol. Chem. 276:21070–21076. - PubMed
