Analysis of optimality in natural and perturbed metabolic networks - PubMed (original) (raw)
Analysis of optimality in natural and perturbed metabolic networks
Daniel Segrè et al. Proc Natl Acad Sci U S A. 2002.
Abstract
An important goal of whole-cell computational modeling is to integrate detailed biochemical information with biological intuition to produce testable predictions. Based on the premise that prokaryotes such as Escherichia coli have maximized their growth performance along evolution, flux balance analysis (FBA) predicts metabolic flux distributions at steady state by using linear programming. Corroborating earlier results, we show that recent intracellular flux data for wild-type E. coli JM101 display excellent agreement with FBA predictions. Although the assumption of optimality for a wild-type bacterium is justifiable, the same argument may not be valid for genetically engineered knockouts or other bacterial strains that were not exposed to long-term evolutionary pressure. We address this point by introducing the method of minimization of metabolic adjustment (MOMA), whereby we test the hypothesis that knockout metabolic fluxes undergo a minimal redistribution with respect to the flux configuration of the wild type. MOMA employs quadratic programming to identify a point in flux space, which is closest to the wild-type point, compatibly with the gene deletion constraint. Comparing MOMA and FBA predictions to experimental flux data for E. coli pyruvate kinase mutant PB25, we find that MOMA displays a significantly higher correlation than FBA. Our method is further supported by experimental data for E. coli knockout growth rates. It can therefore be used for predicting the behavior of perturbed metabolic networks, whose growth performance is in general suboptimal. MOMA and its possible future extensions may be useful in understanding the evolutionary optimization of metabolism.
Figures
Fig. 1.
(A) The optimization principles underlying FBA and MOMA. A schematic 2D depiction of the feasible space for the wild-type (ΦWT) and for mutant of flux j (Φj) is represented by the green and superimposed yellow polygons. The coordinates are two arbitrary representative fluxes, an extremely simplified version of the multidimensional flux space. The solution to the FBA problem is the point that maximizes the objective function (red line). An optimal FBA prediction can be computed both for the wild-type (a) and for a knockout (b). The alternative MOMA knockout solution (c), calculated through QP, can be thought of as a projection of the FBA optimum onto the feasible space of the mutant (Φj). The mutant FBA optimum and the corresponding MOMA solution are, in general, distinct. (B) Robustness analysis for partial deletions. Constraints corresponding to partial gene knockout lead to a feasible space that is intermediate between ΦWT and Φj (pale green). On such intermediate spaces, both the FBA optimum (b′) and the MOMA projection (c′) can be calculated. (C) A robustness analysis method unique to MOMA. One can perform a sampling of the feasible space around the optimum found by simplex in FBA (point a) and find correspondent MOMA projections. The robustness of the MOMA solutions is calculated for a defined threshold of sensitivity of the objective function, for N points obtained by limiting the corresponding fluxes to a given fraction of their wild-type value. This method is useful also for studying the possible multiplicity of MOMA solutions in case alternative FBA optima are present (points a and a′).
Fig. 2.
The suboptimal growth yield calculated using MOMA is plotted vs. the optimal one obtained with FBA, for central carbon metabolism E. coli genes, during growth on glucose. On both axes, growth yields are normalized to the wild-type yield v. Most points are labeled with the gene name. The (+) and (−) signs correspond to genes experimentally verified to be nonessential and essential, respectively. All points lie below the diagonal because of the suboptimal nature of MOMA predictions. A cluster of lethal deletions (bottom left corner) was correctly predicted by FBA and MOMA equally. Another cluster of genes (top right corner) corresponds to genes that are not essential. More interesting are the mutants that do not belong to either of these clusters. These are the ones for which FBA and MOMA predictions differ significantly. Three essential genes (fba, tpiA, pfk) that were not predicted correctly by FBA are predicted correctly with the MOMA calculation. Other points, such as nuoA and cyoA, despite being known to be viable and correctly predicted by FBA, scored lower in MOMA growth function prediction. However, none of the genes that were nonessential in FBA, in agreement with experimental evidence, resulted essential in MOMA.
Fig. 3.
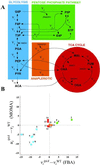
(A) A schematic representation of the central carbon metabolism pathways, inspired by the work of Emmerling et al. (4), in which the numbered fluxes were measured. For fluxes details, see ref. and Table 3, which is published as supporting information on the PNAS web site. The color code is used for emphasizing pathway usage in Figs. 3_B_ and 4. (B) An example of flux prediction for one of the E. coli mutants shown in Fig. 2. The mutant is tpiA, one of the three knockouts predicted correctly by MOMA but not by FBA. Each point corresponds to a flux in the metabolic network of the tpiA knockout, with color coding for different pathways as in A. The abscissa and ordinate correspond to changes in FBA predicted fluxes and MOMA predicted fluxes, respectively, with respect to wild-type prediction. Only a limited portion of the results is displayed here. Fluxes are measured in mmol/g dry weight (DW) per h. The activity of the Pentose Phosphate Pathway, which would intensify in an optimal FBA distribution, does not increase in the MOMA prediction.
Fig. 4.
Comparison of some FBA and MOMA fluxes predictions for pyk knockout with corresponding experimental results from ref. . Fluxes are expressed in percent of the glucose uptake flux. A_–_C relate to the low concentration carbon limited condition (C-0.08); D_–_F relate to the high concentration carbon-limited condition (C-0.4); and G_–_I relate to the nitrogen-limited condition (N-0.09). For each condition, the FBA optimal prediction for the wild type is compared with the experimental result for strain JM101 (A, D, and G). The FBA (B, E, and H) and MOMA (C, F, and I) predictions for the pyk mutant are compared with the experimental results for the knockout strain PB25. Color coding for pathways is as in Fig. 3_A_. The significant improvement in the predictive power for mutants through MOMA is quantitatively analyzed in Table 1.
Similar articles
- Adaptive bi-level programming for optimal gene knockouts for targeted overproduction under phenotypic constraints.
Ren S, Zeng B, Qian X. Ren S, et al. BMC Bioinformatics. 2013;14 Suppl 2(Suppl 2):S17. doi: 10.1186/1471-2105-14-S2-S17. Epub 2013 Jan 21. BMC Bioinformatics. 2013. PMID: 23368729 Free PMC article. - Predicting internal cell fluxes at sub-optimal growth.
Schultz A, Qutub AA. Schultz A, et al. BMC Syst Biol. 2015 Apr 3;9:18. doi: 10.1186/s12918-015-0153-3. BMC Syst Biol. 2015. PMID: 25890056 Free PMC article. - Including metabolite concentrations into flux balance analysis: thermodynamic realizability as a constraint on flux distributions in metabolic networks.
Hoppe A, Hoffmann S, Holzhütter HG. Hoppe A, et al. BMC Syst Biol. 2007 Jun 1;1:23. doi: 10.1186/1752-0509-1-23. BMC Syst Biol. 2007. PMID: 17543097 Free PMC article. - Reconstruction and flux analysis of coupling between metabolic pathways of astrocytes and neurons: application to cerebral hypoxia.
Cakir T, Alsan S, Saybaşili H, Akin A, Ulgen KO. Cakir T, et al. Theor Biol Med Model. 2007 Dec 10;4:48. doi: 10.1186/1742-4682-4-48. Theor Biol Med Model. 2007. PMID: 18070347 Free PMC article. Review. - The application of flux balance analysis in systems biology.
Gianchandani EP, Chavali AK, Papin JA. Gianchandani EP, et al. Wiley Interdiscip Rev Syst Biol Med. 2010 May-Jun;2(3):372-382. doi: 10.1002/wsbm.60. Wiley Interdiscip Rev Syst Biol Med. 2010. PMID: 20836035 Review.
Cited by
- Formalizing the law of diminishing returns in metabolic networks using an electrical analogy.
Petrizzelli M, Coton C, de Vienne D. Petrizzelli M, et al. R Soc Open Sci. 2024 Oct 2;11(10):240165. doi: 10.1098/rsos.240165. eCollection 2024 Oct. R Soc Open Sci. 2024. PMID: 39359456 Free PMC article. - Integration of metabolomics data into metabolic networks.
Töpfer N, Kleessen S, Nikoloski Z. Töpfer N, et al. Front Plant Sci. 2015 Feb 17;6:49. doi: 10.3389/fpls.2015.00049. eCollection 2015. Front Plant Sci. 2015. PMID: 25741348 Free PMC article. Review. - Genetic buffering and potentiation in metabolism.
Poyatos JF. Poyatos JF. PLoS Comput Biol. 2020 Sep 14;16(9):e1008185. doi: 10.1371/journal.pcbi.1008185. eCollection 2020 Sep. PLoS Comput Biol. 2020. PMID: 32925942 Free PMC article. - Analysis of genetic variation and potential applications in genome-scale metabolic modeling.
Cardoso JG, Andersen MR, Herrgård MJ, Sonnenschein N. Cardoso JG, et al. Front Bioeng Biotechnol. 2015 Feb 16;3:13. doi: 10.3389/fbioe.2015.00013. eCollection 2015. Front Bioeng Biotechnol. 2015. PMID: 25763369 Free PMC article. Review. - RELATCH: relative optimality in metabolic networks explains robust metabolic and regulatory responses to perturbations.
Kim J, Reed JL. Kim J, et al. Genome Biol. 2012 Jul 5;13(9):R78. doi: 10.1186/gb-2012-13-9-r78. Genome Biol. 2012. PMID: 23013597 Free PMC article.
References
- Heinrich R. & Schuster, S., (1996) The Regulation of Cellular Systems (Chapman and Hall, New York).
- Schilling C. H., Edwards, J. S. & Palsson, B. O. (1999) Biotechnol. Prog. 15, 288-295. - PubMed
- Stephanopoulos G. & Kelleher, J. (2001) Science 292, 2024-2025. - PubMed
- Covert M. W., Schilling, C. H., Famili, I., Edwards, J. S., Goryanin, II, Selkov, E. & Palsson, B. O. (2001) Trends Biochem. Sci. 26, 179-186. - PubMed
Publication types
MeSH terms
LinkOut - more resources
Full Text Sources
Other Literature Sources


