Nutrient control of gene expression in Drosophila: microarray analysis of starvation and sugar-dependent response - PubMed (original) (raw)
Comparative Study
. 2002 Nov 15;21(22):6162-73.
doi: 10.1093/emboj/cdf600.
Affiliations
- PMID: 12426388
- PMCID: PMC137192
- DOI: 10.1093/emboj/cdf600
Comparative Study
Nutrient control of gene expression in Drosophila: microarray analysis of starvation and sugar-dependent response
Ingo Zinke et al. EMBO J. 2002.
Abstract
We have identified genes regulated by starvation and sugar signals in Drosophila larvae using whole-genome microarrays. Based on expression profiles in the two nutrient conditions, they were organized into different categories that reflect distinct physiological pathways mediating sugar and fat metabolism, and cell growth. In the category of genes regulated in sugar-fed, but not in starved, animals, there is an upregulation of genes encoding key enzymes of the fat biosynthesis pathway and a downregulation of genes encoding lipases. The highest and earliest activated gene upon sugar ingestion is sugarbabe, a zinc finger protein that is induced in the gut and the fat body. Identification of potential targets using microarrays suggests that sugarbabe functions to repress genes involved in dietary fat breakdown and absorption. The current analysis provides a basis for studying the genetic mechanisms underlying nutrient signalling.
Figures
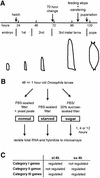
Fig. 1. Larval growth pattern and experimental outline. (A) Drosophila larvae pupariate 5 days AEL under standard conditions, i.e. 25°C, non-crowding. They undergo two molts and grow rapidly in size. The 70 h point is not a morphologically or behaviourally identifiable stage, in contrast to pupariation, wandering behaviour or feeding stoppage (see text for details). (B) Larvae grown on yeast paste on apple juice agar plates (47–49 h AEL) were washed and transferred to appropriate nutrient conditions. After 1, 4 and 12 h, total RNA was isolated and hybridized to microarrays. (C) Three categories were formed based on the expression profile of genes after 4 h treatment in starvation (st 4h) and sugar (su 4h) conditions (see text for details).
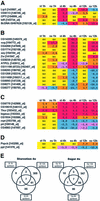
Fig. 2. List of genes that are regulated upon starvation, but not in sugar conditions. Thus, the regulation upon starvation is completely sugar dependent. The treatment was for 4 h. Tabular listing of genes and their fold regulation. Gene names are from FlyBase annotations (Flybase, 1999); the numbers in brackets are Affymetrix probe set names. RT–PCR for selected genes is shown on the right. nc, no change; fold change value of ≤1.0 or ≥–1.0.
Fig. 3. List of genes that are regulated in sugar condition, but not under starvation. Tabular listing of genes and their fold regulation, and selected RT–PCR analysis. We only included those that are regulated with sugar and that showed no change under starvation. Again, we included those genes whose regulation went in the opposite manner to sugar, as for example ATPCL and the lipase CG6277. See Figure 2 for colour code.
Fig. 4. List of genes that are regulated upon starvation and in sugar condition. Tabular listing of genes and their fold regulation, and selected RT–PCR analysis. We took the regulated genes from starvation data and listed those genes that did not differ from this by >2-fold in sugar. See Figure 2 for colour code.
Fig. 5. Time course of gene regulation: 1, 4 and 12 h after appropriate nutrient condition. The panels show genes tested with RT–PCR at 4 h or in situ hybridization. (A) Category I genes: regulated upon starvation, but not in sugar (sorted by regulation in st 4h). (B) Category II genes: regulated in sugar, but not upon starvation (sorted by regulation in su 4h). (C) Category III genes: regulated upon starvation and in sugar (sorted by regulation in st 4h). (D) Regulation of pepck and ppl: note the late regulation of these genes (see text for details). (E) Venn diagrams showing the increase in number of genes regulated (cut-off of 4.0-fold) with increasing times (1, 4 and 12 h) of starvation (left) or sugar conditions (right). See Figure 2 for colour code. st 1h, starved for 1 h; su 1h, sugar fed for 1 h; st 4h, starved for 4 h; su 4h, sugar fed for 4 h; st 12h, starved for 12 h; su 12h, sugar fed for 12 h.
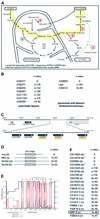
Fig. 6. Candidate genes involved in sugar to fatty acid conversion. (A) Schematic view of a metabolic pathway leading from sugar breakdown to fat synthesis. Genes represented by red circles are upregulated in sugar and those in blue are downregulated. (B) Lipase gene families with members regulated in starved or sugar-fed animals. CG6277, CG6271, CG6283 and CG8093 are all downregulated in sugar-fed larvae, but unaffected in starved larvae; lip3 and CG6113 are upregulated in starved larvae and unaffected in sugar-fed larvae. Blast searches were performed with CG6277 and CG8093 using NCBI Blastp. (C) Tandemly located genes in a lipase cluster (3R; chromosomal locus 97D15-E1). Black boxes indicate lipase genes, the arrows indicate direction of transcription. The three downregulated lipases are noted by a yellow wavy line. White boxes denote the nearest non-lipase genes at this locus. The numbers in kilobases (kb) correspond to those defined in Flybase. (D) Homology of sug to other transcription factor genes. The closest ones belong to Gli zinc finger trancription factors of Xenopus (x), mouse (m), human (h). The zinc finger domain is shown in a grey box; sug protein has five C2H2 motifs (sequence data not shown). (E) Hydropathy plot of CG14205, showing the 10 transmembrane domains; from graphical output of TMHMM (transmembrane helix region prediction program) of Sonnhammer et al. (1998). (F) Homology of CG14205 to other Drosophila (d) and C.elegans (c) genes. All are blasts with NCBI. The asterisks indicate that the three genes are tandemly located. The nrf-6 gene of C.elegans, which was identified as being required for fluoxetine resistance, is boxed.
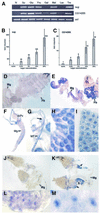
Fig. 7. Sugar-dependent activation of sug and CG14205. (A) Activation of CG14205 and sug by different sugars as shown by RT–PCR analysis. Normal food condition (N), sucrose (Su), glucose (Glu), fructose (Fru), galactose (Gal), maltose (Mal), lactose (Lac) and trehalose (Tre). The concentration of all the sugar solutions is 20%. Note that galactose and lactose have a much less activating effect on the two genes than other sugars tested. (B) Concentration-dependent activation of sug by sugar by real-time PCR analysis. (C) Concentration-dependent activation of CG14205 by sugar by real-time PCR analysis. (D–I) In situ hybridization with sug probe. (D) Larvae grown on normal food; no staining is detectable (Mg, midgut; Fb, fat body). (E) Larvae grown on sugar; note staining in fat body and parts of the midgut. (F) Anterior part of the midgut; the proventriculus (Pv) is not stained. (G) Staining in Malpighian tubules (MT); the arrow indicates the point where MT extends from the gut. (H) Close-up of midgut cells. (I) Close-up of fat body. (J–M) In situ hybridization with CG14205 probe. (J) Larvae grown on normal food; no staining is detectable (Mg, midgut). (K) Larvae grown on sugar; note staining in three parts of the gut (arrows). (L and M) Close-ups of gut cells. Note that CG14205 is highly induced in specific parts of the gut but not in the fat body.
Fig. 8. Identification of potential sug target genes by microarrays. (A) RNA was isolated 6 h after the end of heat shock treatment and hybridized to Affymetrix GeneChip arrays. A list is given of all genes that are strongly regulated (cut-off of 10.0-fold) in larvae overexpressing sug (UAS-sug; left column). Next to each is the fold change of the corresponding gene observed in 4 h sugar-fed larvae (right column). Note that two lipases (CG8093 and CG6277) and a fatty acid transporter (CG11659) show a similar pattern (downregulated) in both cases. See Figure 2 for colour code. (B) All genes up- or downregulated by >2.0-fold upon sug overexpression (left column), and which are also similarly regulated in sugar-fed larvae (category II genes of Figure 3; right column). Note the downregulation of genes encoding lipases and other genes involved in fat catabolism. (C) RT–PCR of three lipase genes in larvae overexpressing sug. (D–I) In situ hybridization of selected potential sug target genes. (D) CG6277, pancreatic lipase (Pv, proventriculus; Mg, midgut). (E) CG8093, lysosomal lipase/cholesterol esterase (MT, Malpighian tubules; the arrow indicates the point where MT extends from the gut). (F) CG6271, pancreatic lipase. (G) CG11659, long chain fatty acid transporter. (H and I) CG15533, sphingomyelinase. (J–O) In situ hybridization of CG6277, CG8093 and CG11659 in normal (Norm, left column) and sugar (Su, right column) conditions. Pv, proventriculus; MT, Malpighian tubules. Note that sugar suppresses expression of all three genes in the larval tissues. (P) A model for the activation of genes by sugar signals. See text for details.
Similar articles
- Identification of genes associated with resilience/vulnerability to sleep deprivation and starvation in Drosophila.
Thimgan MS, Seugnet L, Turk J, Shaw PJ. Thimgan MS, et al. Sleep. 2015 May 1;38(5):801-14. doi: 10.5665/sleep.4680. Sleep. 2015. PMID: 25409104 Free PMC article. - Analysis of hunger-driven gene expression in the Drosophila melanogaster larval central nervous system.
Ryuda M, Shimada K, Koyanagi R, Azumi K, Tanimura T, Hayakawa Y. Ryuda M, et al. Zoolog Sci. 2008 Jul;25(7):746-52. doi: 10.2108/zsj.25.746. Zoolog Sci. 2008. PMID: 18828662 - A buoyancy-based screen of Drosophila larvae for fat-storage mutants reveals a role for Sir2 in coupling fat storage to nutrient availability.
Reis T, Van Gilst MR, Hariharan IK. Reis T, et al. PLoS Genet. 2010 Nov 11;6(11):e1001206. doi: 10.1371/journal.pgen.1001206. PLoS Genet. 2010. PMID: 21085633 Free PMC article. - Starvation-induced elevation of taste responsiveness and expression of a sugar taste receptor gene in Drosophila melanogaster.
Nishimura A, Ishida Y, Takahashi A, Okamoto H, Sakabe M, Itoh M, Takano-Shimizu T, Ozaki M. Nishimura A, et al. J Neurogenet. 2012 Jun;26(2):206-15. doi: 10.3109/01677063.2012.694931. J Neurogenet. 2012. PMID: 22794108 - Genomic analysis of COP9 signalosome function in Drosophila melanogaster reveals a role in temporal regulation of gene expression.
Oron E, Tuller T, Li L, Rozovsky N, Yekutieli D, Rencus-Lazar S, Segal D, Chor B, Edgar BA, Chamovitz DA. Oron E, et al. Mol Syst Biol. 2007;3:108. doi: 10.1038/msb4100150. Epub 2007 May 8. Mol Syst Biol. 2007. PMID: 17486136 Free PMC article.
Cited by
- Skin microbiota analysis in patients with anorexia nervosa and healthy-weight controls reveals microbial indicators of healthy weight and associations with the antimicrobial peptide psoriasin.
Hermes BM, Rademacher F, Chung C, Tiegs G, Bendix MC, de Zwaan M, Harder J, Baines JF. Hermes BM, et al. Sci Rep. 2022 Sep 15;12(1):15515. doi: 10.1038/s41598-022-19676-6. Sci Rep. 2022. PMID: 36109548 Free PMC article. - Developmentally regulated synthesis of p8, a stress-associated transcription cofactor, in diapause-destined embryos of Artemia franciscana.
Qiu Z, MacRae TH. Qiu Z, et al. Cell Stress Chaperones. 2007 Autumn;12(3):255-64. doi: 10.1379/csc-275.1. Cell Stress Chaperones. 2007. PMID: 17915558 Free PMC article. - Gene expression profiling identifies FKBP39 as an inhibitor of autophagy in larval Drosophila fat body.
Juhász G, Puskás LG, Komonyi O, Erdi B, Maróy P, Neufeld TP, Sass M. Juhász G, et al. Cell Death Differ. 2007 Jun;14(6):1181-90. doi: 10.1038/sj.cdd.4402123. Epub 2007 Mar 16. Cell Death Differ. 2007. PMID: 17363962 Free PMC article. - Direct induction of autophagy by Atg1 inhibits cell growth and induces apoptotic cell death.
Scott RC, Juhász G, Neufeld TP. Scott RC, et al. Curr Biol. 2007 Jan 9;17(1):1-11. doi: 10.1016/j.cub.2006.10.053. Curr Biol. 2007. PMID: 17208179 Free PMC article. - Effects of Fructose and Palmitic Acid on Gene Expression in Drosophila melanogaster Larvae: Implications for Neurodegenerative Diseases.
Santos-Cruz LF, Sigrist-Flores SC, Castañeda-Partida L, Heres-Pulido ME, Dueñas-García IE, Piedra-Ibarra E, Ponciano-Gómez A, Jiménez-Flores R, Campos-Aguilar M. Santos-Cruz LF, et al. Int J Mol Sci. 2023 Jun 17;24(12):10279. doi: 10.3390/ijms241210279. Int J Mol Sci. 2023. PMID: 37373426 Free PMC article.
References
- Abu-Elheiga L., Matzuk,M., Abo-Hasema,K. and Wakil,S. (2001) Continuous fatty acid oxidation and reduced fat storage in mice lacking acetyl-CoA carboxylase 2. Science, 291, 2613–2616. - PubMed
- Beadle G., Tatum,E. and Clancy,C. (1938) Food level in relation to rate of development and eye pigmentation in Drosophila melanogaster. Biol. Bull., 75, 447–462.
- Blundell J. (1991) Pharmacological approaches to appetite suppression. Trends Pharm. Sci., 12, 147–157. - PubMed
Publication types
MeSH terms
Substances
LinkOut - more resources
Full Text Sources
Other Literature Sources
Medical
Molecular Biology Databases


