Properties of unitary granule cell-->Purkinje cell synapses in adult rat cerebellar slices - PubMed (original) (raw)
Properties of unitary granule cell-->Purkinje cell synapses in adult rat cerebellar slices
Philippe Isope et al. J Neurosci. 2002.
Abstract
The cerebellar cortex contains huge numbers of synapses between granule cells and Purkinje cells. These synapses are thought to be a major storage site for information required to execute coordinated movements. To obtain a quantitative description of this connection, we recorded unitary synaptic responses between granule cell and Purkinje cell pairs in adult rat cerebellar slices. Our results are consistent with parallel fiber-->Purkinje cell synapses having high release probabilities and modest paired pulse facilitation. However, a wide range of response amplitudes was observed. Indeed, we detected many fewer parallel fiber connections (7% of the granule cells that were screened) than expected (54%), leading us to suggest that up to 85% of parallel fiber-->Purkinje cell synapses do not generate detectable electrical responses. We also investigated the possible role of granule cell ascending axons by recording granule cells near the Purkinje cell. A high proportion (up to 50%) of local granule cells generated detectable synaptic responses. However, most of these connections were indistinguishable from parallel fiber connections, suggesting that powerful ascending axon connections are rare. The existence of many very weak synapses would provide a mechanism for Purkinje cells to extract information selectively from the mass provided by parallel fibers.
Figures
Fig. 1.
Slice orientation. The diagram shows the typical orientation of the cell pairs recorded in this study. Purkinje cells for which the soma was near the surface and for which the dendrites descended into the pseudo-transverse slice were whole-cell clamped. Granule cells within the connected beam were recorded in loose cell-attached mode. The thickness of our slices (450 μm) exceeds the combined depths of the molecular and granule cell layers (220 + 180 μm; Harvey and Napper, 1988), ensuring that parallel fibers (PF) between recorded granule cells (GCs) and Purkinje cells (PC) were not cut at the bottom surface of the slice.
Fig. 2.
Unitary parallel fiber→Purkinje cell connections. A, A granule cell action potential evoked and recorded in loose cell-attached mode. Stimulus timing is indicated by the triangle. The stimulus artifact has been subtracted (see Materials and Methods). B, Several EPSCs recorded in the Purkinje cell (fine lines) plus the average EPSC (thick line; n = 116). Note the slower time base. C, Histogram of the mean amplitudes for all detected EPSCs (n = 34 of 477) of granule cells 300–500 μm from the recorded Purkinje cell. The distribution parameters are reported in Results.
Fig. 3.
Estimating synaptic weights. A, Subthreshold compound EPSCs and EPSPs evoked by the same extracellular stimulation in the granule cell layer. Both synaptic responses are averages of 20 sweeps. Both are fit with bi-exponential functions (superimposed). For the EPSP that is shown, τon = 0.93 msec and τoff = 62 msec; for the EPSC, τon = 0.72 msec and τoff = 15 msec. B, Data like that of_A_ (28 determinations in 10 cells) plotted to obtain an approximate factor of conversion from EPSC to EPSP peak amplitude. The slope of the line constrained to pass through the origin is 8.3 μV/pA.
Fig. 4.
Method of amplitude measurement for individual EPSCs. A, A truncated version of the bi-exponential fit of the average EPSC was scaled to each individual EPSC by using a least-squares criterion, yielding an automatic amplitude estimate for each sweep. The baseline and scaled template are shown superimposed on an EPSC. B, Amplitude distribution (light shaded histogram) for the same connection, constructed from amplitude measurements as in A. An equal number of identical measurements was performed on trace segments in which the granule cell was not stimulated (or active) to estimate the amplitude distribution expected for failures of transmission. This noise distribution was scaled (heavy open histogram) to fit the response distribution for amplitudes greater than (to right of) zero (shaded range). The scaling provides an estimate of the probability of failure, 0.36 in this case.
Fig. 5.
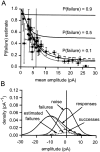
Distribution of failure probability estimates for parallel fiber synapses. A, The failure probability estimates are plotted as a function of mean amplitude with their bootstrap SE estimates. The smooth curves (solid lines) are relations obtained by using the model illustrated in B. Each theoretical relation is for a fixed underlying failure probability (labeled). B, Illustration of the model used to calculate the theoretical curves in_A_. A Gaussian noise distribution (SD of 5.8 pA;noise, shown by a solid line) was convolved with a Gaussian success amplitude distribution [probability of 0.9, amplitude of 11.11 pA, SD of 4.44 pA; therefore, coefficient of variation (CV) of 0.4] and failures (probability of 0.1, amplitude of 0). The resulting distribution components are labeled_successes_ and failures (dotted curves); their sum is the responses probability density function (solid line), which models the experimentally determined amplitude distribution. The best-fit scaled version of the noise distribution is shown also (estimated failures, shown by the dashed line). It overestimates the true failure probability by a factor of ∼2. Variation of the CV of successes had little effect on the overall shape of the amplitude-estimated P relations that were obtained. The dotted and dashed curves in_A_ were obtained with CVs of 0.15 and 0.5, respectively.
Fig. 6.
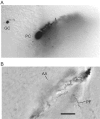
Morphology of a typical intersection of a parallel fiber and a Purkinje cell dendritic tree. Shown are a granule cell (GC) and Purkinje cell (PC) pair filled with biocytin during the whole-cell recording (without a detectable connection) and subsequently labeled. A, Somatic level. The plane of Purkinje cell dendritic tree extends down into the slice in a bottom left to top right plane.B, Near the level of intersection. The parallel fiber (PF) is seen shortly after it has traversed the dendritic tree near its middle. The parallel fiber is an enhanced montage of two images separated by 10 μm vertically. Only a tiny section of the ascending axon (AA) is captured in the image, although it could be followed easily when the focus is adjusted continuously. Scale bar, 50 μm.
Fig. 7.
Action potential propagation along parallel fibers is not compromised. A, Loose cell-attached recording of a granule cell soma during molecular layer stimulation. The latency between the stimulus and arrival of the antidromic action potential (mostly conduction) in this cell was 5.3 msec (top trace, from left triangle to_asterisk_ marking the antidromic action potential). Paired stimuli show that the refractory period was ∼1 msec. The intervals between the two stimuli are 0.9 msec (top trace, one action potential) and 1.0 msec (bottom trace, two action potentials). B, Paired pulse somatic stimuli similarly reveal an orthodromic refractory period of 0.9 msec. The intervals between the two stimuli are 0.8 msec (top trace, one action potential) and 0.9 msec (bottom trace, two action potentials). C, So that annihilation by collision with the orthodromic action potential (somatic stimulation) can be avoided, an antidromic action potential (molecular layer stimulation) must be elicited >6.3 msec later. The intervals between the two stimuli in the panel are 6.3 msec (top trace, antidromic action potential absent) and 6.4 msec (bottom trace, antidromic action potential present). This interval indicates that the orthodromic action potential is conducted to the site of antidromic stimulation, beyond the point at which Purkinje cells would have been recorded. The surprising form of the loose cell-attached action potential signal (e.g., in_A_) corresponds to an intracellular action potential with an inflection on the rising phase. This is because the loose cell-attached signal is essentially a capacity current, proportional to the first derivative of the membrane potential (Barbour and Isope, 2000); as such, it is quite sensitive to changes of action potential shape. The inflection probably reflects a delay between the arrival of the axonal antidromic action potential and invasion of the soma. Most of the orthodromic action potentials elicited in the soma are obscured in part by the stimulus artifacts (which were not subtracted). All action potentials were identified with respect to known failures of excitation.
Fig. 8.
Whole-cell paired recordings reveal no strong parallel fiber connections with very low release probabilities. In each panel the top traces represent the average (black line) of >100 high-frequency bursts of action potentials in a granule cell (gray lines). The bottom traces show the average responses recorded in a Purkinje cell. A, A pair showing no detectable response. The averages were formed after alignment on approximately the fifth action potential of the train (n = 191).B, Another pair in which a response was detected. In the panel the averages were calculated after alignment on the first action potential of the train (n = 137). _A_and B share calibrations. C, A detail (expanded time and current scales) of the averages in _B_shows that a clear response onset (arrow) can be observed some 2 msec after the first action potential (timing indicated by the dashed vertical line).
Fig. 9.
Local granule cells constitute a privileged input, but powerful ascending axon connections are rare. A, Two image planes (top, slice surface; bottom, 10 μm below the surface) showing a labeled Purkinje cell. The intersections of the best-fit plane for the dendritic tree and the image planes are indicated by the dotted lines. The reconstructed positions of connected granule cells are indicated by a_filled circle_ and nonconnected granule cells by a_cross_. Scale bar, 50 μm. B, Apparent connection rate (number of detectable responses/total number of granule cells tested) as a function of distance of the granule cell soma from the dendritic plane of the Purkinje cell. Each bin except the first and last represents 30 tested granule cells. The first (left-most) bin contains 15 granule cells and the last (for granule cells at 300–500 μm) contains 477. The significance of the differences between the apparent connection probabilities near to the Purkinje cell and that for parallel fibers is indicated over the relevant bins by asterisks (**p < 10−5; *p < 0.05; Fisher's Exact Test). The dotted horizontal line indicates the expected probability (0.54) of an anatomically defined synapse existing (see Results). C, Histogram of mean amplitudes for connections from granule cells within 35 μm of the dendritic plane of the Purkinje cell (light lines, shaded bars). Note two large responses of putative ascending axon connections. The distribution parameters were mean = 12.4 pA and SD = 15.7 pA (n = 28 of 166). A similar histogram of a series of connections for which reconstructions were not performed but the granule cell was close to the Purkinje cell is superimposed (heavy lines, open bars). Large responses were also infrequent in this sample. The distribution parameters were mean = 12.4 pA and SD = 14.1 pA (n = 40).
Fig. 10.
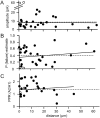
The properties of connections from proximal connections are similar to those of parallel fiber connections. Shown are plots of connection amplitude (A), estimated failure probability (B), and paired pulse ratio (C) as a function of distance from the Purkinje cell dendritic plane. Dashed lines represent the mean values for parallel fiber connections, and the solid lines are the best-fit lines. The two large amplitude connections (open circles) were excluded from the regression calculation for the amplitudes. Note that the mean_P_(failure) estimate (B) represented by the dashed line is for the parallel fiber connections shown in Figure 5_A_.
Fig. 11.
Kinetic properties for all granule cell→Purkinje cell pairs. A, Histogram of rising phase time constant for bi-exponential fits to average EPSCs with an amplitude >5 pA. The filled bars represent parallel fiber connections. B, Similar histogram for decay time constant. C, The bi-exponential fits were used to estimate the mean synaptic charge transfer for each connection (with an amplitude >5 pA).
Fig. 12.
EPSC amplitude is correlated with synaptic charge, but not kinetics. A, Plot of mean EPSC amplitude against reciprocal of the decay time constant from the bi-exponential fit of the EPSC. Small and large EPSCs (_open circles_below and above the dashed lines, respectively) were not included in the regression calculation (see Results). The best-fit regression (solid line) is shown with the 95% confidence limits (dashed curves). B, A similar analysis shows that a significant correlation exists between EPSC charge and amplitude.
Similar articles
- Presynaptic origin of paired-pulse depression at climbing fibre-Purkinje cell synapses in the rat cerebellum.
Hashimoto K, Kano M. Hashimoto K, et al. J Physiol. 1998 Jan 15;506 ( Pt 2)(Pt 2):391-405. doi: 10.1111/j.1469-7793.1998.391bw.x. J Physiol. 1998. PMID: 9490867 Free PMC article. - A change in the pattern of activity affects the developmental regression of the Purkinje cell polyinnervation by climbing fibers in the rat cerebellum.
Andjus PR, Zhu L, Cesa R, Carulli D, Strata P. Andjus PR, et al. Neuroscience. 2003;121(3):563-72. doi: 10.1016/s0306-4522(03)00556-6. Neuroscience. 2003. PMID: 14568018 - Neural plasticity in cerebellar cultures.
Seil FJ. Seil FJ. Prog Neurobiol. 1996 Dec;50(5-6):533-56. doi: 10.1016/s0301-0082(96)00044-5. Prog Neurobiol. 1996. PMID: 9015826 Review. - Using realistic models to study synaptic integration in cerebellar Purkinje cells.
De Schutter E. De Schutter E. Rev Neurosci. 1999;10(3-4):233-45. doi: 10.1515/revneuro.1999.10.3-4.233. Rev Neurosci. 1999. PMID: 10526889 Review.
Cited by
- Memory consolidation in the cerebellar cortex.
Kellett DO, Fukunaga I, Chen-Kubota E, Dean P, Yeo CH. Kellett DO, et al. PLoS One. 2010 Jul 29;5(7):e11737. doi: 10.1371/journal.pone.0011737. PLoS One. 2010. PMID: 20686596 Free PMC article. - Purkinje cell-specific knockout of the protein phosphatase PP2B impairs potentiation and cerebellar motor learning.
Schonewille M, Belmeguenai A, Koekkoek SK, Houtman SH, Boele HJ, van Beugen BJ, Gao Z, Badura A, Ohtsuki G, Amerika WE, Hosy E, Hoebeek FE, Elgersma Y, Hansel C, De Zeeuw CI. Schonewille M, et al. Neuron. 2010 Aug 26;67(4):618-28. doi: 10.1016/j.neuron.2010.07.009. Neuron. 2010. PMID: 20797538 Free PMC article. - Feed-forward inhibition shapes the spike output of cerebellar Purkinje cells.
Mittmann W, Koch U, Häusser M. Mittmann W, et al. J Physiol. 2005 Mar 1;563(Pt 2):369-78. doi: 10.1113/jphysiol.2004.075028. Epub 2004 Dec 21. J Physiol. 2005. PMID: 15613376 Free PMC article. - Discovering Microcircuit Secrets With Multi-Spot Imaging and Electrophysiological Recordings: The Example of Cerebellar Network Dynamics.
Tognolina M, Monteverdi A, D'Angelo E. Tognolina M, et al. Front Cell Neurosci. 2022 Mar 18;16:805670. doi: 10.3389/fncel.2022.805670. eCollection 2022. Front Cell Neurosci. 2022. PMID: 35370553 Free PMC article. Review. - The functional equivalence of ascending and parallel fiber inputs in cerebellar computation.
Walter JT, Dizon MJ, Khodakhah K. Walter JT, et al. J Neurosci. 2009 Jul 1;29(26):8462-73. doi: 10.1523/JNEUROSCI.5718-08.2009. J Neurosci. 2009. PMID: 19571137 Free PMC article.
References
- Albus JS. A theory of cerebellar function. Math Biosci. 1971;10:26–51.
- Barbour B. Synaptic currents evoked in Purkinje cells by stimulating individual granule cells. Neuron. 1993;11:759–769. - PubMed
- Barbour B, Isope P. Combining loose cell-attached stimulation and recording. J Neurosci Methods. 2000;103:199–208. - PubMed
- Barbour B, Keller BU, Llano I, Marty A. Prolonged presence of glutamate during excitatory synaptic transmission to cerebellar Purkinje cells. Neuron. 1994;12:1331–1343. - PubMed
- Batchelor AM, Madge DJ, Garthwaite J. Synaptic activation of metabotropic glutamate receptors in the parallel fibre–Purkinje cell pathway in rat cerebellar slices. Neuroscience. 1994;63:911–915. - PubMed
Publication types
MeSH terms
LinkOut - more resources
Full Text Sources
Other Literature Sources


