Recombinant expression of the voltage-dependent anion channel enhances the transfer of Ca2+ microdomains to mitochondria - PubMed (original) (raw)
Recombinant expression of the voltage-dependent anion channel enhances the transfer of Ca2+ microdomains to mitochondria
Elena Rapizzi et al. J Cell Biol. 2002.
Abstract
Although the physiological relevance of mitochondrial Ca2+ homeostasis is widely accepted, no information is yet available on the molecular identity of the proteins involved in this process. Here we analyzed the role of the voltage-dependent anion channel (VDAC) of the outer mitochondrial membrane in the transmission of Ca2+ signals between the ER and mitochondria by measuring cytosolic and organelle [Ca2+] with targeted aequorins and Ca2+-sensitive GFPs. In HeLa cells and skeletal myotubes, the transient expression of VDAC enhanced the amplitude of the agonist-dependent increases in mitochondrial matrix Ca2+ concentration by allowing the fast diffusion of Ca2+ from ER release sites to the inner mitochondrial membrane. Indeed, high speed imaging of mitochondrial and cytosolic [Ca2+] changes showed that the delay between the rises occurring in the two compartments is significantly shorter in VDAC-overexpressing cells. As to the functional consequences, VDAC-overexpressing cells are more susceptible to ceramide-induced cell death, thus confirming that mitochondrial Ca2+ uptake plays a key role in the process of apoptosis. These results reveal a novel function for the widely expressed VDAC channel, identifying it as a molecular component of the routes for Ca2+ transport across the mitochondrial membranes.
Figures
Figure 1.
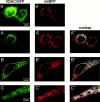
Intracellular distribution of recombinantly expressed VDAC–GFP. HeLa cells and primary myotubes were transfected with VDAC–GFP and placed on the stage of a fluorescence microscope. Acquired images (an example of raw images is shown in a and a') were computationally deblurred as described in Materials and methods. A and B show the two different fluorescence patterns observed in VDAC-overexpressing HeLa cells (see Results); C shows the localization of VDAC–GFP in myotubes. The typical rod-like morphology of mitochondria is apparent from the mtBFP images in HeLa cells (A' and B') and myotubes (C'). A”, B”, and C” represent the overlap images.
Figure 2.
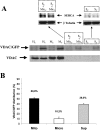
Intracellular distribution of recombinantly expressed VDAC–GFP in HeLa cells. (A) Endogenous VDAC and VDAC–GFP localization was evaluated by subcellular fractionation followed by immunoblotting. In the insets, the immunoblots of a cytosolic (β-tubulin) and ER (SERCA) protein are also shown for validating the separation of microsomal and cytosolic fractions by filtration (see Materials and methods). Total homogenates (H; 10 μg/lane), mitochondria (M; 10 μg/lane), supernatant with microsomes (S + Mic; 20 μg/lane), and pure supernatant (S; 20 μg/lane) from control (C) and VDAC–GFP-transfected (T) cells were separated on 14% SDS-PAGE and probed with an anti-VDAC polyclonal antibody as described in Materials and methods. The results shown are representatives of three replicates. (B) The graph shows the cellular distribution of overexpressed VDAC–GFP in HeLa cells calculated from the densitometric analysis of immunoblots (n = 3).
Figure 3.
Effect of VDAC overexpression on mitochondrial Ca2 + homeostasis in myotubes and HeLa cells. [Ca2+]m was measured in VDAC–GFP + mtAEQmut (VDAC-overexpressing cells, gray traces) or mtAEQmut (control, black traces)-expressing cells. Where indicated, myotubes (A) and HeLa cells (B) were stimulated with 500 μM carbachol and 100 μM histamine, respectively, added to the perfusion medium. The traces are representative of >10 trials.
Figure 4.
Effect of VDAC overexpression on ER Ca2 + homeostasis. [Ca2+]er was measured with erAEQmut. Where indicated, the cells were challenged with 100 μM histamine (A) or 30 μM tBuBHQ (B). The traces are representative of >10 trials. VDAC-overexpressing and control cells are labeled as in Fig. 3.
Figure 5.
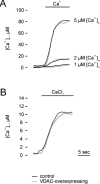
Effect of VDAC overexpression on mitochondrial Ca2 + uptake in permeabilized HeLa cells and during capacitative Ca2 + entry in intact HeLa cells. In A, cells were permeabilized as described in Materials and methods. Where indicated, IB/EGTA was replaced with Ca2+-buffered IB containing 1, 2, and 5 μM [Ca2+]. In B, capacitative Ca2+ entry was initiated in intact tBuBHQ-treated cells by replacing KRB/EGTA with KRB supplemented with 2 mM CaCl2. Trace labeling and all conditions as in Fig. 3.
Figure 6.
Schematic model of the alternative mechanisms by which VDAC overexpression could affect mitochondrial Ca2 + homeostasis and effect of VDAC overexpression on mitochondrial Ca2 + uptake in repetitively challenged HeLa cells. (A) A higher number of VDAC molecules could either induce the formation of additional ER/mitochondria “signaling units” (left) or increase the outer membrane permeability at the contacts between mitochondria and ER (right). (B) Aequorin consumption in the 1st agonist-dependent increases in [Ca2+]m using high and low affinity mitochondrial-targeted aequorin (mtAEQwt, mtAEQmut) in control and VDAC-overexpressing cells (black and gray columns, respectively). The data show the integral of aequorin light emission during the [Ca2+]m increase, expressed as the percentage of the total light discharge of the experiment. (C) Representative traces of the increases in [Ca2+]m caused by repetitive histamine stimulation as measured with mtAEQmut. Trace labeling and all conditions as in Fig. 3.
Figure 7.
Spatial relationship between ER, VDAC, and mitochondria. Representative images of control and VDAC-overexpressing cells (upper and lowercase letters, respectively, n = 5) are shown. Images were acquired, deblurred, thresholded, and analyzed as described in Materials and methods. VDAC–GFP (VDAC overexpressed in the transfected cells, no signal in the control cell) (A and a); anticalreticulin labeling (B and b); mtBFP (C and c); three- dimensional overlay between mtBFP and anticalreticulin and in both images the percentage of mitochondrial surface that colocalized with ER was ∼29% (D and d). Panels E and e shows the overlays between mtBFP (blue), total mitochondrial endogenous VDAC (orange and white), and the mitochondrial endogenous VDAC that colocalized with calreticulin (white only), which is almost 63% of the total mitochondrial endogenous VDAC in both cases. Panel f shows the overlay between mtBFP (blue), total overexpressed mitochondrial VDAC–GFP (green and white), and mitochondrial VDAC–GFP that colocalized with calreticulin (white only).
Figure 8.
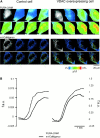
Simultaneous single cell imaging of mitochondrial and cytosolic [Ca2 + ] changes in single cell. In A, the imaging of Fura-2/AM (top) and mt-CaMgaroo (bottom) is shown. The black and white images show Fura-2/AM and three-dimensional CaMgaroo distribution within the cells. The pseudocolored images (350 nm/380 nm ratio for Fura-2/AM and 514 excitation for CaMgaroo) show the changes in fluorescence after a 5-s puff of histamine (10 μM). At each time point (200 ms apart), the [Ca2+] is measured simultaneously in the cytosol and mitochondria as described in Materials and methods. In B, the traces representing the changes in fluorescence (f.a.u., fluorescence arbitrary units) of [Ca2+]c (dotted lines) and [Ca2+]m (continuous lines) are shown. Images and traces are representative of six trials.
Figure 9.
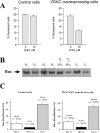
C2 ceramide-induced cell death and intracellular Bax localization. (A) Cell viability was evaluated after a 16-h treatment with C2 ceramide (10 μM) in control (mtGFP-transfected) and VDAC-overexpressing (VDAC–GFP-transfected) cells. The data show the percentage of GFP fluorescent cells in the surviving cell population (see Results). Average values were obtained from analyzing >50 fields in three independent experiments. (B) Effect of VDAC overexpression on intracellular Bax distribution in HeLa cells. Bax localization was evaluated by immunoblotting. Total homogenates (H; 10 μg/lane), mitochondria (M; 10 μg/lane), supernatant with microsomes (S + Mic; 10 μg/lane) and pure supernatant (S; 10 μg/lane) from control (C) and VDAC–GFP- transfected (T) cells were separated on 14% SDS-PAGE and probed with polyclonal antibodies against Bax as described in Materials and methods. The results shown are representatives of three replicates. (C) The graph shows the cellular distribution of Bax in HeLa cells calculated from the densitometric analysis of immunoblots (n = 3).
Figure 10.
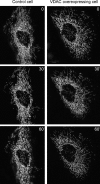
Morphological changes in the mitochondrial network induced by C2 ceramide. Mitochondrial structure was evaluated in control (mtRFP-transfected) and VDAC-overexpressing (mtRFP-VDAC–GFP–cotransfected) cells immediately before (time 0) and 30 and 60 min after the addition of C2 ceramide (10 μM). The images are representative of >10 independent experiments that gave similar results.
Similar articles
- Bcl-2 family proteins regulate the release of apoptogenic cytochrome c by the mitochondrial channel VDAC.
Shimizu S, Narita M, Tsujimoto Y. Shimizu S, et al. Nature. 1999 Jun 3;399(6735):483-7. doi: 10.1038/20959. Nature. 1999. PMID: 10365962 - Mouse uterine epithelial apoptosis is associated with expression of mitochondrial voltage-dependent anion channels, release of cytochrome C from mitochondria, and the ratio of Bax to Bcl-2 or Bcl-X.
Takagi-Morishita Y, Yamada N, Sugihara A, Iwasaki T, Tsujimura T, Terada N. Takagi-Morishita Y, et al. Biol Reprod. 2003 Apr;68(4):1178-84. doi: 10.1095/biolreprod.102.007997. Epub 2002 Oct 30. Biol Reprod. 2003. PMID: 12606449 - The voltage-dependent anion channel: an essential player in apoptosis.
Tsujimoto Y, Shimizu S. Tsujimoto Y, et al. Biochimie. 2002 Feb-Mar;84(2-3):187-93. doi: 10.1016/s0300-9084(02)01370-6. Biochimie. 2002. PMID: 12022949 Review. - The mitochondrial voltage-dependent anion channel (VDAC) as a therapeutic target for initiating cell death.
Granville DJ, Gottlieb RA. Granville DJ, et al. Curr Med Chem. 2003 Aug;10(16):1527-33. doi: 10.2174/0929867033457214. Curr Med Chem. 2003. PMID: 12871124 Review. - Essential role of voltage-dependent anion channel in various forms of apoptosis in mammalian cells.
Shimizu S, Matsuoka Y, Shinohara Y, Yoneda Y, Tsujimoto Y. Shimizu S, et al. J Cell Biol. 2001 Jan 22;152(2):237-50. doi: 10.1083/jcb.152.2.237. J Cell Biol. 2001. PMID: 11266442 Free PMC article.
Cited by
- JNK1/2 regulates ER-mitochondrial Ca2+ cross-talk during IL-1β-mediated cell death in RINm5F and human primary β-cells.
Verma G, Bhatia H, Datta M. Verma G, et al. Mol Biol Cell. 2013 Jun;24(12):2058-71. doi: 10.1091/mbc.E12-12-0885. Epub 2013 Apr 24. Mol Biol Cell. 2013. PMID: 23615449 Free PMC article. - Endoplasmic Reticulum-Mitochondria Contact Sites-Emerging Intracellular Signaling Hubs.
Aoyama-Ishiwatari S, Hirabayashi Y. Aoyama-Ishiwatari S, et al. Front Cell Dev Biol. 2021 May 20;9:653828. doi: 10.3389/fcell.2021.653828. eCollection 2021. Front Cell Dev Biol. 2021. PMID: 34095118 Free PMC article. Review. - Calcium transfer from the ER to other organelles for optimal signaling in Toxoplasma gondii.
Li ZH, Asady B, Chang L, Triana MAH, Li C, Coppens I, Moreno SNJ. Li ZH, et al. bioRxiv [Preprint]. 2024 Dec 5:2024.08.15.608087. doi: 10.1101/2024.08.15.608087. bioRxiv. 2024. PMID: 39185237 Free PMC article. Preprint. - VDAC: old protein with new roles in diabetes.
Sasaki K, Donthamsetty R, Heldak M, Cho YE, Scott BT, Makino A. Sasaki K, et al. Am J Physiol Cell Physiol. 2012 Nov 15;303(10):C1055-60. doi: 10.1152/ajpcell.00087.2012. Epub 2012 Sep 12. Am J Physiol Cell Physiol. 2012. PMID: 22972802 Free PMC article. - Mitochondrial calcium uniporter protein MCU is involved in oxidative stress-induced cell death.
Liao Y, Hao Y, Chen H, He Q, Yuan Z, Cheng J. Liao Y, et al. Protein Cell. 2015 Jun;6(6):434-42. doi: 10.1007/s13238-015-0144-6. Epub 2015 Mar 11. Protein Cell. 2015. PMID: 25753332 Free PMC article.
References
- Barrero, M.J., M. Montero, and J. Alvarez. 1997. Dynamics of [Ca2+] in the endoplasmic reticulum and cytoplasm of intact HeLa cells: a comparative study. J. Biol. Chem. 272:27694–27699. - PubMed
Publication types
MeSH terms
Substances
Grants and funding
- GM 61981/GM/NIGMS NIH HHS/United States
- HL 61297/HL/NHLBI NIH HHS/United States
- 486/B/TI_/Telethon/Italy
- R01 GM061981/GM/NIGMS NIH HHS/United States
- R01 HL061297/HL/NHLBI NIH HHS/United States
LinkOut - more resources
Full Text Sources
Other Literature Sources
Molecular Biology Databases
Research Materials
Miscellaneous
