Molecular characterization of lymphatic endothelial cells - PubMed (original) (raw)
Comparative Study
. 2002 Dec 10;99(25):16069-74.
doi: 10.1073/pnas.242401399. Epub 2002 Nov 22.
Affiliations
- PMID: 12446836
- PMCID: PMC138566
- DOI: 10.1073/pnas.242401399
Comparative Study
Molecular characterization of lymphatic endothelial cells
Simona Podgrabinska et al. Proc Natl Acad Sci U S A. 2002.
Erratum in
- Proc Natl Acad Sci U S A. 2003 Apr 15;100(8):4970
Abstract
The lymphatic microvasculature is uniquely adapted for the continuous removal of interstitial fluid and proteins and is an important entry point for leukocytes and tumor cells. Specialized functions of lymphatics suggest differences in the molecular composition of the lymphatic and blood vascular endothelium. However, the extent to which the two cell types differ is still unclear, and few molecules that are truly specific to lymphatic endothelial cells have been identified to date. We have isolated primary lymphatic and blood microvascular endothelial cells from human skin by immunoselection with the lymphatic marker LYVE-1 and demonstrate that the two cell lineages express distinct sets of vascular markers and respond differently to growth factors and extracellular matrix. Comparative microarray analysis of gene-expression profiles revealed a number of unique molecular properties that distinguish lymphatic and blood vascular endothelium. The molecular profile of lymphatic endothelium seems to reflect characteristic functional and structural features of the lymphatic capillaries. Classification of the differentially expressed genes into functional groups revealed particularly high levels of genes implicated in protein sorting and trafficking, indicating a more active role of lymphatic endothelium in uptake and transport of molecules than previously anticipated. The identification of a large number of genes selectively expressed by lymphatic endothelium should facilitate the discovery of hitherto unknown lymphatic vessel markers and provide a basis for the analysis of the molecular mechanisms accounting for the characteristic functions of lymphatic capillaries.
Figures
Fig. 1.
Selective expression of vascular markers in human skin vasculature. (A) Double immunofluorescent staining for LYVE-1 (red) and a PAL-E, a marker of blood vessels (green), in a 50-μm thick section of human foreskin. The stainings are mutually exclusive, indicating high specificity of LYVE-1 antibody for lymphatic vessels. Note high lymphatic vessel density. (B_–_D) Fluorescent staining for LYVE-1 (red), CD31 (green), or both together (merged), respectively, demonstrates that all LYVE-1+ vessels are also CD31+. (E and F) Double-staining for CD34 (red) and PAL-E (green) revealed identical expression pattern in blood vessels (E), whereas LYVE-1+ lymphatic vessels (green) do not express CD34 (F). (G and H) Smooth muscle α-actin (red) was colocalized with PAL-E (green) in blood vessels (G) but was absent from LYVE-1+ vessels (H). Arrows point to the lymphatics; arrowheads point to blood vessels; dots indicate dermal-epidermal junction. (Bar = 100 μm.)
Fig. 2.
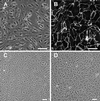
Purification of lymphatic and blood microvascular endothelium. (A) Primary culture consisting mainly of ECs, a few fibroblasts, and keratinocytes, with LYVE-1-coated magnetic beads attached to the subpopulation of ECs. (B) After the second purification step, all cells are stained with the CD31 antibody at cell junctions, indicating a pure endothelial population. (C and D) Confluent layers of lymphatic (C) and blood vascular (D) ECs at passage 7. (Bar = 25 μm.)
Fig. 3.
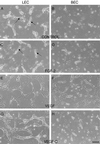
Selective effects of VEGF-C on survival and tube formation by LECs in a collagen gel. Cells either received no treatment (A and B) or were exposed to exogenous FGF-2 (C and D), VEGF (E and F), or VEGF-C (G and H). (Bar = 25 μm.)
Fig. 4.
Quantitative assessment of LEC and BEC network formation in the collagen gel. Total length of cell cords formed after 48 h was measured. Data are expressed as total cord length (in μm ± SEM) per field from at least 15 fields. Data are pooled from four experiments. The unpaired Student's t test was used for statistical analyses. LEC control vs. FGF, P = 0.5; vs. VEGF, P < 0.001; vs. VEGF-C, P < 0.001. BEC control vs. FGF, P = 0.5; vs. VEGF, P < 0.001; vs. VEGF-C, P < 0.05.
Fig. 5.
Differential expression of vascular markers by cultured LECs and BECs. (A) Western and Northern analyses of LYVE-1 expression. Two major bands of LYVE-1 protein (≈70 and 200 kDa) and RNA (2.0 and 2.6 kb) were expressed in LECs. Hybridization with a β-actin cDNA probe was performed as a loading control for the Northern analysis. For Western analyses, equal amounts of proteins were loaded. (B) Western analyses of CD31, VEGFR-2, VEGFR-3, and plakophilin expression. Positions of molecular mass markers are shown in kDa.
Fig. 6.
Quantitative assessment of differential gene expression.
Similar articles
- Lymphatic endothelium: morphological, molecular and functional properties.
Pepper MS, Skobe M. Pepper MS, et al. J Cell Biol. 2003 Oct 27;163(2):209-13. doi: 10.1083/jcb.200308082. J Cell Biol. 2003. PMID: 14581448 Free PMC article. Review. - [Characterization of markers and growth factors for lymphatic endothelium].
Waś H. Waś H. Postepy Biochem. 2005;51(2):209-14. Postepy Biochem. 2005. PMID: 16209358 Review. Polish. - Isolation and characterization of lymphatic microvascular endothelial cells from human tonsils.
Garrafa E, Alessandri G, Benetti A, Turetta D, Corradi A, Cantoni AM, Cervi E, Bonardelli S, Parati E, Giulini SM, Ensoli B, Caruso A. Garrafa E, et al. J Cell Physiol. 2006 Apr;207(1):107-13. doi: 10.1002/jcp.20537. J Cell Physiol. 2006. PMID: 16261591 - The transcription factor Prox1 is a marker for lymphatic endothelial cells in normal and diseased human tissues.
Wilting J, Papoutsi M, Christ B, Nicolaides KH, von Kaisenberg CS, Borges J, Stark GB, Alitalo K, Tomarev SI, Niemeyer C, Rössler J. Wilting J, et al. FASEB J. 2002 Aug;16(10):1271-3. doi: 10.1096/fj.01-1010fje. Epub 2002 Jun 7. FASEB J. 2002. PMID: 12060670 - Interstitial flow as a guide for lymphangiogenesis.
Boardman KC, Swartz MA. Boardman KC, et al. Circ Res. 2003 Apr 18;92(7):801-8. doi: 10.1161/01.RES.0000065621.69843.49. Epub 2003 Mar 6. Circ Res. 2003. PMID: 12623882
Cited by
- Single Cell Analysis of Lung Lymphatic Endothelial Cells and Lymphatic Responses during Influenza Infection.
Ge J, Shao H, Ding H, Huang Y, Wu X, Sun J, Que J. Ge J, et al. J Respir Biol Transl Med. 2024 Mar;1(1):10003. doi: 10.35534/jrbtm.2024.10003. Epub 2024 Feb 19. J Respir Biol Transl Med. 2024. PMID: 38529320 Free PMC article. - Glymphatic and lymphatic communication with systemic responses during physiological and pathological conditions in the central nervous system.
Licastro E, Pignataro G, Iliff JJ, Xiang Y, Lo EH, Hayakawa K, Esposito E. Licastro E, et al. Commun Biol. 2024 Feb 24;7(1):229. doi: 10.1038/s42003-024-05911-5. Commun Biol. 2024. PMID: 38402351 Free PMC article. Review. - Microbial-Dependent Recruitment of Immature Myeloid Cells Promotes Intestinal Regeneration.
Jiang Z, Waterbury QT, Malagola E, Fu N, Kim W, Ochiai Y, Wu F, Guha C, Shawber CJ, Yan KS, Wang TC. Jiang Z, et al. Cell Mol Gastroenterol Hepatol. 2024;17(3):321-346. doi: 10.1016/j.jcmgh.2023.10.007. Epub 2023 Oct 28. Cell Mol Gastroenterol Hepatol. 2024. PMID: 37898454 Free PMC article. - Editorial: Manipulation of immune-vascular crosstalk in solid tumors.
Kumar V. Kumar V. Front Immunol. 2023 Oct 5;14:1295953. doi: 10.3389/fimmu.2023.1295953. eCollection 2023. Front Immunol. 2023. PMID: 37868975 Free PMC article. No abstract available. - Immunomodulatory properties of the lymphatic endothelium in the tumor microenvironment.
Viúdez-Pareja C, Kreft E, García-Caballero M. Viúdez-Pareja C, et al. Front Immunol. 2023 Sep 7;14:1235812. doi: 10.3389/fimmu.2023.1235812. eCollection 2023. Front Immunol. 2023. PMID: 37744339 Free PMC article. Review.
References
- Rusznyak I., Foldi, M. & Szabo, G., (1967) Lymphatics and Lymph Circulation (Pergamon, Oxford).
- Swartz A. & Skobe, M. (2001) Microsc. Res. Tech. 55, 92-99. - PubMed
- Yoffey J. M. & Courtice, F. C., (1970) Lymphatics, Lymph and the Lymphomyeloid Complex (Academic, London).
- Casley-Smith J. R. & Florey, H. W. (1961) Q. J. Exp. Physiol. 46, 101-105. - PubMed
- Leak L. V. (1970) Microvasc. Res. 2, 361-391. - PubMed
Publication types
MeSH terms
Substances
LinkOut - more resources
Full Text Sources
Other Literature Sources
Miscellaneous


