Correction of the iron overload defect in beta-2-microglobulin knockout mice by lactoferrin abolishes their increased susceptibility to tuberculosis - PubMed (original) (raw)
Correction of the iron overload defect in beta-2-microglobulin knockout mice by lactoferrin abolishes their increased susceptibility to tuberculosis
Ulrich E Schaible et al. J Exp Med. 2002.
Abstract
As a resident of early endosomal phagosomes, Mycobacterium tuberculosis is connected to the iron uptake system of the host macrophage. beta-2-microglobulin (beta2m) knockout (KO) mice are more susceptible to tuberculosis than wild-type mice, which is generally taken as a proof for the role of major histocompatibility complex class I (MHC-I)-restricted CD8 T cells in protection against M. tuberculosis. However, beta2m associates with a number of MHC-I-like proteins, including HFE. This protein regulates transferrin receptor mediated iron uptake and mutations in its gene cause hereditary iron overload (hemochromatosis). Accordingly, beta2m-deficient mice suffer from tissue iron overload. Here, we show that modulating the extracellular iron pool in beta2m-KO mice by lactoferrin treatment significantly reduces the burden of M. tuberculosis to numbers comparable to those observed in MHC class I-KO mice. In parallel, the generation of nitric oxide impaired in beta2m-KO mice was rescued. Conversely, iron overload in the immunocompetent host exacerbated disease. Consistent with this, iron deprivation in infected resting macrophages was detrimental for intracellular mycobacteria. Our data establish: (a) defective iron metabolism explains the increased susceptibility of beta2m-KO mice over MHC-I-KO mice, and (b) iron overload represents an exacerbating cofactor for tuberculosis.
Figures
Figure 1.
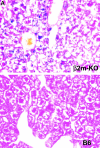
Iron overload in β2m KO mice and susceptibility to M. tuberculosis of experimentally iron overloaded mice. (A) Iron-specific staining by Prussian blue of liver sections revealed iron overload in β2m–KO as compared with B6 mice (representative specimens from one out of five mice per group). (B) Iron overload in β2m–KO mice was verified by measuring iron content in organs of each mouse strain (data from five mice ± SD out of three experiments). (C) Elevated iron concentrations in organs from mice treated with Fe3+Ci (values from five mice ± SD, one out of three experiments). (D) Experimental iron overload increased growth of M. tuberculosis in B6 mice. Mice (n = 5) were infected with M. tuberculosis by aerosol and treated with Fe via the drinking water. Bacterial load was measured in the lungs at day 15 (**P < 0.005 as determined by the non paired Mann-Whitney test; one representative experiment out of three).
Figure 2.
Depletion of iron inhibits and excess iron enhances growth of M. tuberculosis in broth culture. Mycobacterial growth was monitored by OD600 (A) and CFU (B) in the presence or absence of Fe3+Ci, deferroxamine (def), a mixture of both or lactoferrin. Results indicate mean ± SD of three individual cultures. Shown are representative independent experiments out of three for each set up.
Figure 3.
Lactoferrin decreased growth of M. tuberculosis in β2m KO but not in MHC class I KO mice. (A) Lactoferrin treatment reduced the growth of M. tuberculosis in β2m–KO but not B6 mice. Mice were infected with 159 bacteria/lung by aerosol and bacterial load was measured at 22 d after infection (untreated, closed symbols; lactoferrin treatment, open symbols). (B) Lactoferrin treatment decreased growth of M. tuberculosis in β2m–KO but less so in B6 or MHC class I KO mice. Mice were infected with 155 bacteria/lung by aerosol and bacterial load was measured at 27 d after infection (untreated, closed symbols; lactoferrin treatment, open symbols). Statistics: *P < 0.01, **P < 0.005 as determined by the non paired Mann-Whitney test (data from one representative experiment out of three). (C) Serum levels of NO measured as NO2 in mice at 27 d after infection by aerosol with five M. tuberculosis/lung (untreated, closed symbols; lactoferrin treated, open symbols).
Figure 4.
Lactoferrin decreased growth of M. tuberculosis in macrophages from both B6 and β2m-KO mice. Bone marrow–derived macrophages were infected with M. tuberculosis at a MOI of 2:1. 2 h after infection the cells were washed and further cultured for 4 d in the absence or presence of lactoferrin or an anti-TfR antibody. Mycobacterial growth was measured by CFU at the indicated time points (data ± SD from one representative experiment out of four).
Figure 5.
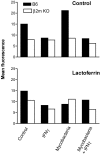
Reduced TfR expression on macrophages from β2m–KO mice. Bone marrow–derived macrophages from B6 and β2m KO mice were treated with IFN-γ, lactoferrin, and/or mycobacteria (10:1) for 48 h and analyzed by flow cytometry using the rat anti–murine TfR Tib-219 (data ± SD from one representative experiment out of three).
Similar articles
- Regulation of transferrin-mediated iron uptake by HFE, the protein defective in hereditary hemochromatosis.
Waheed A, Grubb JH, Zhou XY, Tomatsu S, Fleming RE, Costaldi ME, Britton RS, Bacon BR, Sly WS. Waheed A, et al. Proc Natl Acad Sci U S A. 2002 Mar 5;99(5):3117-22. doi: 10.1073/pnas.042701499. Epub 2002 Feb 26. Proc Natl Acad Sci U S A. 2002. PMID: 11867720 Free PMC article. - ESAT-6 Protein of Mycobacterium tuberculosis Increases Holotransferrin-Mediated Iron Uptake in Macrophages by Downregulating Surface Hemochromatosis Protein HFE.
Jha V, Pal R, Kumar D, Mukhopadhyay S. Jha V, et al. J Immunol. 2020 Dec 1;205(11):3095-3106. doi: 10.4049/jimmunol.1801357. Epub 2020 Nov 4. J Immunol. 2020. PMID: 33148716 - Increased susceptibility to Mycobacterium avium in hemochromatosis protein HFE-deficient mice.
Gomes-Pereira S, Rodrigues PN, Appelberg R, Gomes MS. Gomes-Pereira S, et al. Infect Immun. 2008 Oct;76(10):4713-9. doi: 10.1128/IAI.00612-08. Epub 2008 Aug 11. Infect Immun. 2008. PMID: 18694968 Free PMC article. - Recent advances in the pathophysiology, diagnosis and treatment of hereditary hemochromatosis and other iron overload syndromes.
Pirisi M, Avellini C, Scott CA, Toniutto P, Intersimone D, Aprile G, Branca B, Fumo E. Pirisi M, et al. Adv Clin Path. 2001 Oct;5(4):121-31. Adv Clin Path. 2001. PMID: 17582936 Review. - The structure and function of HFE.
Drakesmith H, Townsend A. Drakesmith H, et al. Bioessays. 2000 Jul;22(7):595-8. doi: 10.1002/1521-1878(200007)22:7<595::AID-BIES1>3.0.CO;2-E. Bioessays. 2000. PMID: 10878571 Review.
Cited by
- Solanum lycopersicum heme-binding protein 2 as a potent antimicrobial weapon against plant pathogens.
Farvardin A, Llorens E, Liu-Xu L, Sánchez-Giménez L, Wong A, Biosca EG, Pedra JM, Falomir E, Camañes G, Scalschi L, Vicedo B. Farvardin A, et al. Sci Rep. 2023 Nov 20;13(1):20336. doi: 10.1038/s41598-023-47236-z. Sci Rep. 2023. PMID: 37990046 Free PMC article. - Trace metal elements: a bridge between host and intestinal microorganisms.
Ma Y, Fei Y, Ding S, Jiang H, Fang J, Liu G. Ma Y, et al. Sci China Life Sci. 2023 Sep;66(9):1976-1993. doi: 10.1007/s11427-022-2359-4. Epub 2023 Jul 28. Sci China Life Sci. 2023. PMID: 37528296 Review. - Mycobacterium tuberculosis hijacks host TRIM21- and NCOA4-dependent ferritinophagy to enhance intracellular growth.
Dai Y, Zhu C, Xiao W, Huang K, Wang X, Shi C, Lin D, Zhang H, Liu X, Peng B, Gao Y, Liu CH, Ge B, Kaufmann SH, Feng CG, Chen X, Cai Y. Dai Y, et al. J Clin Invest. 2023 Apr 17;133(8):e159941. doi: 10.1172/JCI159941. J Clin Invest. 2023. PMID: 37066876 Free PMC article. - Iron Status and Supplementation during Tuberculosis.
Nienaber A, Uyoga MA, Dolman-Macleod RC, Malan L. Nienaber A, et al. Microorganisms. 2023 Mar 18;11(3):785. doi: 10.3390/microorganisms11030785. Microorganisms. 2023. PMID: 36985358 Free PMC article. Review. - Strongyloidiasis stercoralis coinfection is associated with altered iron status biomarkers in tuberculous lymphadenitis.
Kathamuthu GR, Rajamanickam A, Sridhar R, Baskaran D, Babu S. Kathamuthu GR, et al. Front Immunol. 2022 Oct 20;13:999614. doi: 10.3389/fimmu.2022.999614. eCollection 2022. Front Immunol. 2022. PMID: 36341407 Free PMC article.
References
- Schaible, U.E., S. Sturgill-Koszycki, P. Schlesinger, and D.G. Russell. 1998. Cytokine activation leads to acidification and increases maturation of Mycobacterium avium-containing phagosomes in murine macrophages. J. Immunol. 160:1290–1296. - PubMed
- Rolph, M.S., B. Raupach, H.H. Kobernick, H.L. Collins, B. Perarnau, F.A. Lemonnier, and S.H.E. Kaufmann. 2001. MHC class Ia-restricted T cells partially account for beta2-microglobulin-dependent resistance to Mycobacterium tuberculosis. Eur. J. Immunol. 31:1944–1949. - PubMed
MeSH terms
Substances
LinkOut - more resources
Full Text Sources
Medical
Molecular Biology Databases
Research Materials


