Heterogeneous expression of the triggering receptor expressed on myeloid cells-2 on adult murine microglia - PubMed (original) (raw)
Heterogeneous expression of the triggering receptor expressed on myeloid cells-2 on adult murine microglia
Christoph D Schmid et al. J Neurochem. 2002 Dec.
Abstract
Microglial activation is an early and common feature of almost all neuropathologies, including multiple sclerosis, Alzheimer's disease and mechanical injury. To better understand the relative contributions microglia make toward neurodegeneration and neuroprotection, we used TOGA(R) to identify molecules expressed by microglia and regulated by inflammatory signals. Triggering receptor expressed on myeloid cells-2 (TREM-2) was among the mRNAs identified as being expressed by unactivated microglia, but down-regulated by lipopolysaccharide/interferon gamma. In the healthy CNS, not all microglia expressed TREM-2. Microglial expression of TREM-2 varied not only between brain regions but also within each brain region. Brain regions with an incomplete blood-brain barrier had the lowest percentages of TREM-2- expressing microglia, whereas the lateral entorhinal and cingulate cortex had the highest percentages. A novel form of TREM-2b that lacked a transmembrane domain was detected, perhaps indicating a soluble form of the protein. Taken together, these data suggest that (1) subsets of microglia are specialized to respond to defined extracellular signals; and (2) regional variations in TREM-2 expression may contribute to the varying sensitivities of different brain regions to similar pathological signals.
Figures
Fig. 1
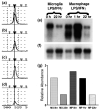
LPS/IFNγ decreases microglial (MG) and macrophage (MP) expression of TREM-2. (a–d) TOGA® profile for the product corresponding to TREM-2. The displayed TOGA® profile represents a small region of one of the 256 TOGA® electropherograms for each of the templates prepared from unstimulated cultured microglia (a), LPS/IFNγ-stimulated cultured microglia (b), unstimulated peritoneal macrophages (c) and LPS/IFNγ-stimulated peritoneal macrophages (d). The symbols on the top of (a–d) refer to the digital addresses (predicted positions) of known molecules. More details can be found in Sutcliffe et al. (2000). A line is drawn through the TOGA® PCR product corresponding to TREM-2. Peak amplitude corresponds to product abundance. (e) Northern blot with poly(A)+ RNA (2 μg/lane) prepared from unstimulated and LPS/IFNγ-stimulated cultured microglia and peritoneal macrophages was probed with a 32P-labeled TREM-2 cDNA clone. To determine the relative abundance of TREM-2 per sample, the same northern blot was re-probed with a RNA loading control, 32P-labeled cyclophilin cDNA clone (f), and the levels of TREM-2 relative to those of the loading control were quantified by densitometric analysis (g).
Fig. 2
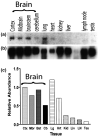
Northern blot analysis of TREM-2 expression in healthy adult mouse tissues. (a) Northern blot with poly(A)+ RNA (2 μg/lane) prepared from several adult mouse tissues was probed with a 32P-labeled TREM-2 cDNA clone. To determine the relative abundance of TREM-2 per sample, the same northern blot was re-probed with a RNA loading control, 32P-labeled β-actin cDNA clone (b), and the levels of TREM-2 relative to those of the loading control were quantified by densitometric analysis (c).
Fig. 3
TREM-2 is expressed by lectin-positive cells in healthy adult murine brain. in situ hybridization analysis using a 35S-labeled antisense TREM-2 riboprobe (black grains) was performed on coronal sections from the CNS of untreated control mice (a and b) or from mice receiving intracerebral injections of LPS/IFNγ (c and d). In (a) and (c), the focal plane is at the level of lectin staining. In (b) and (d), the focal plane is at the level of the silver grains within the photographic emulsion. All nuclei are labeled with hematoxylin (in blue), and all myeloid cells and blood vessels are labeled with tomato lectin (in brown). Areas displayed are from the cingulate cortex. The thin upward pointing arrows in (a) and (b) indicate TREM-2-positive microglia and the thick downward pointing arrows in (a–d) indicate TREM-2-negative microglia. All cryosections were 25 μm in thickness. Magnification × 40.
Fig. 4
Induction of IRG2 expression reveals widespread activation caused by intracerebral injection of LPS/IFNγ. (a) Coronal section taken from a control mouse hybridized with a 35S-labeled sense TREM-2 riboprobe and counterstained as detailed in Fig. 3. in situ hybridization analysis using a 35S-labeled antisense IRG2 riboprobe was performed on coronal sections taken from the same unmanipulated control (b) as depicted in Figs 3(a) and (b) and 4(a), and on coronal sections taken from the same LPS/IFNγ-injected mice (c–f) as depicted in Figs 3(c) and (d). The focal plane is at the level of silver grains in the photographic emulsion. The white arrow in Fig. 4 shows the brain region depicted in Figs 3(c) and (d). Magnification × 40.
Fig. 5
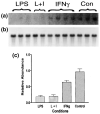
Northern blot analysis of TREM-2 expression after LPS and/or IFNγ treatment. Total RNA was prepared from three mice intracerebrally injected with LPS alone, two mice intracerebrally injected with LPS and IFNγ (L + I), four mice intracerebrally injected with IFNγ alone and three untreated control mice (Con). Total RNA (10 μg) from a single mouse brain was run in each lane. This northern blot was probed with a 32P-labeled TREM-2 cDNA clone (a). To determine the relative abundance of TREM-2 per sample, the same northern blot was re-probed with a RNA loading control, 32P-labeled β-actin cDNA clone (b), and the levels of TREM-2 with respect to those of the loading control were quantified by densitometric analysis (c).
Fig. 6
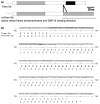
An alternative TREM-2b splice product generates a molecule lacking a transmembrane domain and DAP12-binding domain. (a) Schematic diagram of the two forms of TREM-2b. Grey regions depict the IgV-type domain encoded by both the major (smaller membrane bound) and minor (larger splice variant) TREM-2b transcripts. The stippled region depicts the transmembrane domain encoded by the major TREM-2b transcript. The region with wavy lines depicts the frameshift in protein translation caused by the alternative splice site in the minor svTREM-2b. (b) Nucleotide sequence of the minor TREM-2b variant and the putative protein sequences of the two forms of TREM-2b from the end of exon 3 to the carboxy-terminus. The nucleotide sequence of the 55-bp insertion in the minor variant is highlighted in italic bold type. The amino acid sequence differences between the two forms of TREM-2b are displayed beneath the nucleotide sequence. The transmembrane domain present in the major transcript is shown in bold type in the upper conceptual protein translation.
Fig. 7
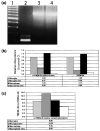
The minor svTREM-2b is not a pseudogene contaminant. (a) TREM-2b primers, corresponding to the 3′ terminal region of exon 3 and the 5′ region of exon 4, were used for RT-PCR analysis of cDNA template prepared from unstimulated microglia (lane 2) and genomic C57BL/6J DNA (lane 3, 100 ng; lane 4, 500 ng); 100-bp molecular weight ladder is shown in lane 1. (b and c) Relative expression levels of both the original membrane-bound major form (TREM-2b) and the non-membrane-bound splice variant form (svTREM-2b) were determined by real-time quantitative RT-PCR. In (b), the relative levels of svTREM-2b and TREM-2b in each sample are represented as the amplification cycle number at which the amplified product could be detected above the Ct compared with the same cycle Ct value observed in unstimulated microglia (control). (c) Relative ratio of svTREM-2b to TREM-2b in unstimulated microglia, LPS/IFNγ-stimulated microglia, unstimulated macrophages and LPS/IFNγ-stimulated macrophages.
Similar articles
- Lipopolysaccharide-induced up-regulation of triggering receptor expressed on myeloid cells-1 expression on macrophages is regulated by endogenous prostaglandin E2.
Murakami Y, Kohsaka H, Kitasato H, Akahoshi T. Murakami Y, et al. J Immunol. 2007 Jan 15;178(2):1144-50. doi: 10.4049/jimmunol.178.2.1144. J Immunol. 2007. PMID: 17202378 - Opposing roles of the triggering receptor expressed on myeloid cells 2 and triggering receptor expressed on myeloid cells-like transcript 2 in microglia activation.
Zheng H, Liu CC, Atagi Y, Chen XF, Jia L, Yang L, He W, Zhang X, Kang SS, Rosenberry TL, Fryer JD, Zhang YW, Xu H, Bu G. Zheng H, et al. Neurobiol Aging. 2016 Jun;42:132-41. doi: 10.1016/j.neurobiolaging.2016.03.004. Epub 2016 Mar 16. Neurobiol Aging. 2016. PMID: 27143430 Free PMC article. - The emerging role of the microglia triggering receptor expressed on myeloid cells (TREM) 2 in multiple sclerosis.
Farzan M, Saberi-Rounkian M, Asadi-Rizi A, Heidari Z, Farzan M, Fathi M, Aghaei A, Azadegan-Dehkordi F, Bagheri N. Farzan M, et al. Exp Neurol. 2025 Feb;384:115071. doi: 10.1016/j.expneurol.2024.115071. Epub 2024 Nov 23. Exp Neurol. 2025. PMID: 39586397 Review. - Induction of triggering receptor expressed on myeloid cells 1 in murine resident peritoneal macrophages by monosodium urate monohydrate crystals.
Murakami Y, Akahoshi T, Hayashi I, Endo H, Kawai S, Inoue M, Kondo H, Kitasato H. Murakami Y, et al. Arthritis Rheum. 2006 Feb;54(2):455-62. doi: 10.1002/art.21633. Arthritis Rheum. 2006. PMID: 16447220
Cited by
- Distinct Features of Brain-Resident Macrophages: Microglia and Non-Parenchymal Brain Macrophages.
Lee E, Eo JC, Lee C, Yu JW. Lee E, et al. Mol Cells. 2021 May 31;44(5):281-291. doi: 10.14348/molcells.2021.0060. Mol Cells. 2021. PMID: 33972475 Free PMC article. Review. - Circulating Soluble TREM2 and Cardiovascular Outcome in Cohort Study of Coronary Atherosclerosis Patients.
Cuciuc V, Tshori S, Grib L, Sella G, Tuvali O, Volodarsky I, Welt M, Fassler M, Shimoni S, George J. Cuciuc V, et al. Int J Mol Sci. 2022 Oct 28;23(21):13121. doi: 10.3390/ijms232113121. Int J Mol Sci. 2022. PMID: 36361908 Free PMC article. - Transcript profiles of dendritic cells of PLOSL patients link demyelinating CNS disorders with abnormalities in pathways of actin bundling and immune response.
Kiialainen A, Veckman V, Saharinen J, Paloneva J, Gentile M, Hakola P, Hemelsoet D, Ridha B, Kopra O, Julkunen I, Peltonen L. Kiialainen A, et al. J Mol Med (Berl). 2007 Sep;85(9):971-83. doi: 10.1007/s00109-007-0191-4. Epub 2007 May 26. J Mol Med (Berl). 2007. PMID: 17530208 - Triggering receptor expressed on myeloid cells-2 expression in the brain is required for maximal phagocytic activity and improved neurological outcomes following experimental stroke.
Kurisu K, Zheng Z, Kim JY, Shi J, Kanoke A, Liu J, Hsieh CL, Yenari MA. Kurisu K, et al. J Cereb Blood Flow Metab. 2019 Oct;39(10):1906-1918. doi: 10.1177/0271678X18817282. Epub 2018 Dec 7. J Cereb Blood Flow Metab. 2019. PMID: 30523715 Free PMC article. - Role of microglia in neuronal degeneration and regeneration.
Walter L, Neumann H. Walter L, et al. Semin Immunopathol. 2009 Nov;31(4):513-25. doi: 10.1007/s00281-009-0180-5. Epub 2009 Sep 9. Semin Immunopathol. 2009. PMID: 19763574 Review.
References
- Aloisi F. Immune function of microglia. Glia. 2001;36:165–179. - PubMed
- Bakker AB, Hoek RM, Cerwenka A, Blom B, Lucian L, McNeil T, Murray R, Phillips LH, Sedgwick JD, Lanier LL. DAP12-deficient mice fail to develop autoimmunity due to impaired antigen priming. Immunity. 2000;13:345–353. - PubMed
- Becher B, Prat A, Antel JP. Brain-immune connection: immuno-regulatory properties of CNS-resident cells. Glia. 2000;29:293–304. - PubMed
- Betmouni S, Perry VH, Gordon JL. Evidence for an early inflammatory response in the central nervous system of mice with scrapie. Neuroscience. 1996;74:1–5. - PubMed
- Bouchon A, Dietrich J, Colonna M. Cutting edge: inflammatory responses can be triggered by TREM-1, a novel receptor expressed on neutrophils and monocytes. J. Immunol. 2000;164:4991–4995. - PubMed
Publication types
MeSH terms
Substances
LinkOut - more resources
Full Text Sources
Other Literature Sources
Molecular Biology Databases
