Increased expression of interleukin 17 in inflammatory bowel disease - PubMed (original) (raw)
Comparative Study
Increased expression of interleukin 17 in inflammatory bowel disease
S Fujino et al. Gut. 2003 Jan.
Abstract
Background and aim: Interleukin (IL) 17 is a cytokine which exerts strong proinflammatory activities. In this study we evaluated changes in IL-17 expression in the inflamed mucosa and in the serum of patients with inflammatory bowel disease (IBD).
Methods: Tissue samples were obtained endoscopically or surgically from patients with ulcerative colitis (UC) (n=20), Crohn's disease (CD) (n=20), infectious colitis (n=5), ischaemic colitis (n=8), and normal colorectal tissues (n=15). IL-17 expression was evaluated by a standard immunohistochemical procedure. Serum IL-17 levels were determined by ELISA. IL-17 mRNA expression was analysed by reverse transcriptase-polymerase chain reaction.
Results: IL-17 expression was not detected in samples from normal colonic mucosa, infectious colitis, or ischaemic colitis. In the inflamed mucosa of active UC and CD patients, IL-17 expression was clearly detectable in CD3(+) T cells or CD68(+) monocytes/macrophages. The average number of IL-17(+) cells was significantly increased in active UC and CD patients compared with inactive patients. IL-17 mRNA expression was not detected in normal mucosa but was detectable in the mucosa from active UC and CD patients. IL-17 was not detected in the sera from normal individuals, infectious colitis, or ischaemic colitis patients but IL-17 levels were significantly elevated in IBD patients.
Conclusions: IL-17 expression in the mucosa and serum was increased in IBD patients. It is likely that IL-17 expression in IBD may be associated with altered immune and inflammatory responses in the intestinal mucosa.
Figures
Figure 1
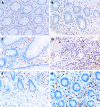
Immunohistochemical analysis of interleukin 17 (IL-17) protein expression in the colon. (A) Control normal mucosa (×200); (B) ischaemic colitis (×200); (C) and (D) ulcerative colitis (×200); (E) and (F) Crohn’s disease (×100 and ×200).
Figure 2
Number of interleukin 17 (IL-17) positive cells in the mucosa. Results are expressed as number of positive cells per field (×400). The lower and upper margins of the box represent the 25th and 75th percentiles, with the extended arms representing the 10th and 90th percentiles, respectively. The median is shown as a horizontal line within the box. UC, ulcerative colitis; CD, Crohn’s disease.
Figure 3
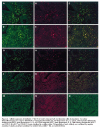
Cellular expression of interleukin 17 (IL-17) in Crohn’s disease (A–F) and ulcerative colitis (G–L) patients. Two colour immunofluorescence was used to determine IL-17 expression (rhodamine red, red fluorescence: B, E, H, and K), CD3 expression (fluorescein isothiocyanate (FITC), green fluorescence: A, G), and CD68 expression (FITC, green fluorescence: D, J). Cells showing coexpression of IL-17 and CD3 (C, I) or IL-17 and CD68 (F, L) were visualised by a yellow colour. The specificity of each antibody was confirmed by negative reactivity of subclass matched normal IgG for anti-CD3 (M), anti-IL-17 (N), and anti-CD68 (O).
Figure 4
Reverse transcription-polymerase chain reaction (RT-PCR) analysis of interleukin 17 (IL-17) mRNA expression. Purified T cells were stimulated by interleukin 2 for three hours, and purified monocytes/macrophages were stimulated by lipopolysaccharide for three hours. Total cellular RNA was extracted by the acid guanidium thiocyanate-phenol-chloroform (AGPC) method and IL-17 mRNA expression was evaluated by RT-PCR analysis. Similarly, IL-17 mRNA expression was investigated in mucosal samples from normal individuals and in active Crohn’s disease (CD) and ulcerative colitis (UC) patients.
Figure 5
Serum interleukin 17 (IL-17) levels in patients with inflammatory bowel disease. IL-17 level was determined by ELISA for human IL-17 purchased from Bio Source International (Camarillo, California, USA). The lower limit of ELISA was 9 pg/ml of IL-17. The lower and upper margins of the box represent the 25th and 75th percentiles, with the extended arms representing the 10th and 90th percentiles, respectively. The median is shown as a horizontal line within the box. UC, ulcerative colitis; CD, Crohn’s disease.
Similar articles
- Upregulation of interleukin-12 and -17 in active inflammatory bowel disease.
Nielsen OH, Kirman I, Rüdiger N, Hendel J, Vainer B. Nielsen OH, et al. Scand J Gastroenterol. 2003 Feb;38(2):180-5. doi: 10.1080/00365520310000672. Scand J Gastroenterol. 2003. PMID: 12678335 - Over-expression of interleukin 10 in mucosal T cells of patients with active ulcerative colitis.
Melgar S, Yeung MM, Bas A, Forsberg G, Suhr O, Oberg A, Hammarstrom S, Danielsson A, Hammarstrom ML. Melgar S, et al. Clin Exp Immunol. 2003 Oct;134(1):127-37. doi: 10.1046/j.1365-2249.2003.02268.x. Clin Exp Immunol. 2003. PMID: 12974765 Free PMC article. - Interleukin-18 is increased only in a minority of patients with active Crohn's disease.
Schmidt C, Giese T, Goebel R, Schilling M, Marth T, Ruether A, Schreiber S, Zeuzem S, Meuer SC, Stallmach A. Schmidt C, et al. Int J Colorectal Dis. 2007 Sep;22(9):1013-20. doi: 10.1007/s00384-007-0282-2. Epub 2007 Feb 21. Int J Colorectal Dis. 2007. PMID: 17318554 - Biologic therapies against inflammatory bowel disease: a dysregulated immune system and the cross talk with gastrointestinal mucosa hold the key.
Dharmani P, Chadee K. Dharmani P, et al. Curr Mol Pharmacol. 2008 Nov;1(3):195-212. doi: 10.2174/1874467210801030195. Curr Mol Pharmacol. 2008. PMID: 20021434 Review. - Inflammatory mediators in chronic inflammatory bowel diseases.
Gross V, Andus T, Leser HG, Roth M, Schölmerich J. Gross V, et al. Klin Wochenschr. 1991 Dec 15;69(21-23):981-7. doi: 10.1007/BF01645143. Klin Wochenschr. 1991. PMID: 1798295 Review.
Cited by
- Human β-defensin 3 peptide is increased and redistributed in Crohn's ileitis.
Meisch JP, Nishimura M, Vogel RM, Sung HC, Bednarchik BA, Ghosh SK, Fu P, McCormick T, Weinberg A, Levine AD. Meisch JP, et al. Inflamm Bowel Dis. 2013 Apr;19(5):942-53. doi: 10.1097/MIB.0b013e318280b11a. Inflamm Bowel Dis. 2013. PMID: 23511030 Free PMC article. - Structural determinant for inducing RORgamma specific inverse agonism triggered by a synthetic benzoxazinone ligand.
Marcotte DJ, Liu Y, Little K, Jones JH, Powell NA, Wildes CP, Silvian LF, Chodaparambil JV. Marcotte DJ, et al. BMC Struct Biol. 2016 Jun 1;16(1):7. doi: 10.1186/s12900-016-0059-3. BMC Struct Biol. 2016. PMID: 27246200 Free PMC article. - Crotoxin from Crotalus durissus terrificus is able to down-modulate the acute intestinal inflammation in mice.
Almeida Cde S, Andrade-Oliveira V, Câmara NO, Jacysyn JF, Faquim-Mauro EL. Almeida Cde S, et al. PLoS One. 2015 Apr 8;10(4):e0121427. doi: 10.1371/journal.pone.0121427. eCollection 2015. PLoS One. 2015. PMID: 25853847 Free PMC article. - Loss and dysregulation of Th17 cells during HIV infection.
Bixler SL, Mattapallil JJ. Bixler SL, et al. Clin Dev Immunol. 2013;2013:852418. doi: 10.1155/2013/852418. Epub 2013 May 23. Clin Dev Immunol. 2013. PMID: 23762098 Free PMC article. Review. - IL-33 Aggravates DSS-Induced Acute Colitis in Mouse Colon Lamina Propria by Enhancing Th2 Cell Responses.
Zhu J, Yang F, Sang L, Zhai J, Zhang X, Yue D, Li S, Li Y, Lu C, Sun X. Zhu J, et al. Mediators Inflamm. 2015;2015:913041. doi: 10.1155/2015/913041. Epub 2015 May 28. Mediators Inflamm. 2015. PMID: 26161006 Free PMC article.
References
- Boirivant, M, Marini, M, DiFelice, et al. Lamina propria T cells in Crohn’s disease and other gastrointestinal inflammation show defective CD2 pathway-induced apoptosis. Gastroenterology 1999;116:557–65. - PubMed
- Saubermann LJ, Probert CSJ, Christ AD, et al. Evidence of T cell receptor β-chain patterns in inflammatory and noninflammatory bowel disease states Am J Physiol 1999;276:G613–21. - PubMed
- Fossiez F, Banchereau J, Murry R, et al. Interleukin-17. Intern Rev Immunol 1998;16:541–51. - PubMed
Publication types
MeSH terms
Substances
LinkOut - more resources
Full Text Sources
Other Literature Sources


