PNPase activity determines the efficiency of mRNA 3'-end processing, the degradation of tRNA and the extent of polyadenylation in chloroplasts - PubMed (original) (raw)
PNPase activity determines the efficiency of mRNA 3'-end processing, the degradation of tRNA and the extent of polyadenylation in chloroplasts
Michael Walter et al. EMBO J. 2002.
Abstract
The exoribonuclease polynucleotide phosphorylase (PNPase) has been implicated in mRNA processing and degradation in bacteria as well as in chloroplasts of higher plants. Here, we report the first comprehensive in vivo study of chloroplast PNPase function. Modulation of PNPase activity in Arabidopsis chloroplasts by a reverse genetic approach revealed that, although this enzyme is essential for efficient 3'-end processing of mRNAs, it is insufficient to mediate transcript degradation. Surprisingly, we identified PNPase as also being indispensable for 3'-end maturation of 23S rRNA transcripts. Analysis of tRNA amounts in transgenic Arabidopsis plants suggests a direct correlation of PNPase activity and tRNA levels, indicating an additional function of this exoribo nuclease in tRNA decay. Moreover, the extent of polyadenylated mRNAs in chloroplasts is negatively correlated with PNPase activity. Together, our results attribute novel functions to PNPase in the metabolism of all major classes of plastid RNAs and suggest an unexpectedly complex role for PNPase in RNA processing and decay.
Figures
Fig. 1. Structural comparison of different plant and bacterial PNPases. The domain structures of plastid PNPases from Arabidopsis and spinach are compared with PNPase enzymes from E.coli and Synechocystis. The conserved S1, RNase PH and KH domains and the transit peptide are marked as indicated in the bottom right of the figure. The degree of amino acid identity is depicted in the bottom left.
Fig. 2. Modulation of chloroplast PNPase activity in transgenic plants. (A) Schematic diagram of the transformed T-DNA. The PNPase cDNA sequence was fused to the FLAG tag sequence (FT) and expressed under control of the CaMV 35S promoter (35S) and the TMV translation enhancing omega element (Ω). Transformed plants were selected for BASTA resistance (BAR). uidA, β-glucuronidase; NosT, termination signal. (B–E) PNPase expression in transgenic plants. (B) Expres sion of the FLAG-tagged and the endogenous PNPases was surveyed by western analyses after separation by SDS–PAGE and transfer to PVDF membranes. For the analysis of transgene expression, the monoclonal FLAG-M2 antibody (Sigma) was used (Anti-FLAG). The transgenic and endogenous form of PNPase was detected with a polyclonal antiserum against spinach PNPase (Anti-PNP; Hayes et al., 1996). The arrowhead marks the signal for the endogenous PNPase in the wild-type (WT) lane. The asterisk marks unspecific signals due to long exposure. The figure exemplarily depicts the analyses of a wild-type line and two representative transgenic lines either over-expressing the transgene (PNP+, +) or exhibiting reduction of PNPase expression caused by co-suppression (PNP–, –). (C) Chloroplasts from PNPase over-expressing plants were isolated and, following the indicated treatments, 8 µg of soluble proteins were analyzed by SDS–PAGE and western blotting. The FLAG-tagged PNPase co-purified together with isolated chloroplasts (lane 4). Resistance to thermolysin treatment verified the integrity of the isolated chloroplasts and the efficient import of the recombinant protein (lane 1). Disruption of the plastids by sonication prior to protease addition led to digestion of the protein (lane 2), whereas sonication treatment alone did not affect PNPase content of the sample (lane 3). (D) UV cross-linking analysis of PNPase expression. Leaf total soluble proteins (10 µg) were cross-linked to a radioactive probe corresponding to the spinach petD 3′ UTR (Hayes et al., 1996). PNPase protein was detected by autoradiography after separation by SDS–PAGE. Total RNAs from wild-type plants and from three independent transgenic lines showing moderate over-expression (+), strong over-expression (++) or no expression (–) of the FLAG-tagged PNPase were used. C, no protein added. (E) Quantification of PNPase protein amounts in wild-type and transgenic Arabidopsis lines. A dilution series of soluble proteins from wild-type and different amounts of protein from transgenic plants were analyzed by UV cross-linking as described in (D). Signals were quantified by phosphoimaging.
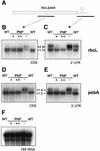
Fig. 3. Northern analysis of plants transformed with FLAG-tagged PNPase. (A) Schematic diagram of the location of the probes used for northern hybridizations within the rbcL and psbA mRNA (black bars). (B and D) Northern hybridizations with _rbcL_- and _psbA_-specific probes corresponding to the respective coding regions (CDS). The labeling of the investigated lines corresponds to Figure 2D. (C and E) Identical membranes were analyzed with probes specific for the unprocessed 3′ trailer (3′ UTR) of rbcL and psbA, respectively. (F) Control hybridization with a probe for the nuclear-encoded 18S rRNA. The numbers indicate the sizes of the detected RNA species (in kb).
Fig. 4. Plastid protein biosynthesis in plants with modified PNPase expression. (A) Analysis of polysome association of rbcL and psbA mRNAs in wild-type, PNPase over-expressing (PNP++) and PNPase co-suppressed (PNP–) plants. Polysomal RNA was separated in a continuous sucrose gradient. As a control, a sample of wild-type polysomes was separated in the presence of 20 mM EDTA to dissociate the ribosomal subunits. RNAs from different fractions were separated by denaturing agarose gel electrophoresis, transferred to nylon membranes and hybridized with probes containing the 3′ trailer and sequences downstream (described in Figure 3A) for psbA (upper and middle) and rbcL (lower). The structure of the mRNA molecules is depicted schematically on the left. (B) Western analysis of chloroplast proteins. After electrophoretic separation, leaf soluble protein extracts and membrane-enriched fractions (upper and lower panel, respectively) were transferred onto PVDF membranes. Immunodetections were performed with antisera against the large subunit of RubisCO (LSU) and the D1 subunit of PSII (D1), respectively. Proteins (10 µg) from wild-type (WT1), PNPase over-expressing (PNP+/++) and PNPase co-suppressed (PNP–) plants as well as dilutions of wild-type protein extracts (WT1/2 and WT1/4) were analyzed. (C) Analysis of protein composition of thylakoid membranes in wild-type, PNPase over-expressing (++) and PNPase co-suppressed (–) Arabidopsis plants. Thylakoid membrane proteins were isolated, separated on a 16% SDS–Tris–Tricine polyacrylamide gel and stained with silver. Proteins identified according to their known separation characteristics are indicated on the right. M, molecular weight marker.
Fig. 5. Analysis of rRNA expression and processing. (A) Schematic diagram of the organization of the rRNA operon and the location of the probes used for northern hybridizations (black bars). Gray boxes indicate structural RNAs, white boxes indicate introns and lines show intergenic sequences. (B) An ethidium bromide-stained gel after electrophoretic separation of total leaf RNA. The arrow indicates a rRNA fragment, which is shifted in size compared with the wild type (WT). (C–E) Results of northern analyses of three identical membranes with the probes indicated in (A). The probes were specific for 16S rRNA (C), the complete 23S rRNA (D) or the 3′ end (315 nucleotides) of the 23S rRNA (E). The numbers on the right indicate the sizes of detected RNA species (in kb). The arrows in (D) mark fragments, which are shifted in size compared with the wild type.
Fig. 6. Expression analysis of the psaA operon and chloroplast tRNAs. (A) Schematic diagram of the psaA operon and location of the probes used for northern analyses (black bars). (B–D) Results from northern hybridizations of four identical membranes to the probes indicated in (A). The probes were specific for the coding regions of psaA (B), rps14 (C) and tRNAfMet (D, upper), respectively. The faint hybridization signals detected in (B) and (C) do not correspond to monocistronic processing products and most likely represent degradation intermediates. Oligonucleotide probes complementary to nucleotides 35–74 were used for expression analyses of tRNAPro (D, lower). The numbers indicate the sizes of the detected RNA species (in kb).
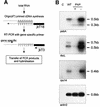
Fig. 7. PNPase activity and the extent of chloroplast mRNA polyadenyl ation are inversely correlated. (A) Scheme of the amplification and detection of polyadenylated mRNAs. (B) Southern blot analyses of RT–PCR products containing poly(A) sequences after 20 cycles of amplification. Equal amounts of RNA from wild-type (WT), PNPase over-expressing (+) and PNPase co-suppressed (–) plants were used for cDNA synthesis. A primer pair specifically amplifying the nuclear- encoded and constitutively expressed actin2 transcript was used as a control. C, RNA without reverse transcription.
Similar articles
- Mutational analysis of Arabidopsis chloroplast polynucleotide phosphorylase reveals roles for both RNase PH core domains in polyadenylation, RNA 3'-end maturation and intron degradation.
Germain A, Herlich S, Larom S, Kim SH, Schuster G, Stern DB. Germain A, et al. Plant J. 2011 Aug;67(3):381-94. doi: 10.1111/j.1365-313X.2011.04601.x. Epub 2011 May 25. Plant J. 2011. PMID: 21466602 - Polyadenylation in Arabidopsis and Chlamydomonas organelles: the input of nucleotidyltransferases, poly(A) polymerases and polynucleotide phosphorylase.
Zimmer SL, Schein A, Zipor G, Stern DB, Schuster G. Zimmer SL, et al. Plant J. 2009 Jul;59(1):88-99. doi: 10.1111/j.1365-313X.2009.03853.x. Epub 2009 Feb 26. Plant J. 2009. PMID: 19309454 - Relaxed transcription in Arabidopsis mitochondria is counterbalanced by RNA stability control mediated by polyadenylation and polynucleotide phosphorylase.
Holec S, Lange H, Kühn K, Alioua M, Börner T, Gagliardi D. Holec S, et al. Mol Cell Biol. 2006 Apr;26(7):2869-76. doi: 10.1128/MCB.26.7.2869-2876.2006. Mol Cell Biol. 2006. PMID: 16537927 Free PMC article. - Regulation and functions of bacterial PNPase.
Briani F, Carzaniga T, Dehò G. Briani F, et al. Wiley Interdiscip Rev RNA. 2016 Mar-Apr;7(2):241-58. doi: 10.1002/wrna.1328. Epub 2016 Jan 11. Wiley Interdiscip Rev RNA. 2016. PMID: 26750178 Review. - Polynucleotide phosphorylase: Not merely an RNase but a pivotal post-transcriptional regulator.
Cameron TA, Matz LM, De Lay NR. Cameron TA, et al. PLoS Genet. 2018 Oct 11;14(10):e1007654. doi: 10.1371/journal.pgen.1007654. eCollection 2018 Oct. PLoS Genet. 2018. PMID: 30307990 Free PMC article. Review.
Cited by
- Stable PNPase RNAi silencing: its effect on the processing and adenylation of human mitochondrial RNA.
Slomovic S, Schuster G. Slomovic S, et al. RNA. 2008 Feb;14(2):310-23. doi: 10.1261/rna.697308. Epub 2007 Dec 14. RNA. 2008. PMID: 18083837 Free PMC article. - Impact of PNPase on the transcriptome of Rhodobacter sphaeroides and its cooperation with RNase III and RNase E.
Spanka DT, Reuscher CM, Klug G. Spanka DT, et al. BMC Genomics. 2021 Feb 6;22(1):106. doi: 10.1186/s12864-021-07409-4. BMC Genomics. 2021. PMID: 33549057 Free PMC article. - A Member of the Arabidopsis Mitochondrial Transcription Termination Factor Family Is Required for Maturation of Chloroplast Transfer RNAIle(GAU).
Romani I, Manavski N, Morosetti A, Tadini L, Maier S, Kühn K, Ruwe H, Schmitz-Linneweber C, Wanner G, Leister D, Kleine T. Romani I, et al. Plant Physiol. 2015 Sep;169(1):627-46. doi: 10.1104/pp.15.00964. Epub 2015 Jul 7. Plant Physiol. 2015. PMID: 26152711 Free PMC article. - Overaccumulation of the chloroplast antisense RNA AS5 is correlated with decreased abundance of 5S rRNA in vivo and inefficient 5S rRNA maturation in vitro.
Sharwood RE, Hotto AM, Bollenbach TJ, Stern DB. Sharwood RE, et al. RNA. 2011 Feb;17(2):230-43. doi: 10.1261/rna.2336611. Epub 2010 Dec 9. RNA. 2011. PMID: 21148395 Free PMC article. - PRBP plays a role in plastid ribosomal RNA maturation and chloroplast biogenesis in Nicotiana benthamiana.
Park YJ, Cho HK, Jung HJ, Ahn CS, Kang H, Pai HS. Park YJ, et al. Planta. 2011 Jun;233(6):1073-85. doi: 10.1007/s00425-011-1362-7. Epub 2011 Feb 3. Planta. 2011. PMID: 21290146
References
- Carpousis A.J., Vanzo,N.F. and Raynal,L.C. (1999) mRNA degradation. A tale of poly(A) and multiprotein machines. Trends Genet., 15, 24–28. - PubMed
- Coburn G.A. and Mackie,G.A. (1999) Degradation of mRNA in Escherichia coli: an old problem with some new twists. Prog. Nucleic Acid Res. Mol. Biol., 62, 55–108. - PubMed
- Decker C.J. (1998) The exosome: a versatile RNA processing machine. Curr. Biol., 8, R238–R240. - PubMed
Publication types
MeSH terms
Substances
LinkOut - more resources
Full Text Sources
Molecular Biology Databases


