A role for cryptochromes in sleep regulation - PubMed (original) (raw)
A role for cryptochromes in sleep regulation
Jonathan P Wisor et al. BMC Neurosci. 2002.
Abstract
Background: The cryptochrome 1 and 2 genes (cry1 and cry2) are necessary for the generation of circadian rhythms, as mice lacking both of these genes (cry1,2-/-) lack circadian rhythms. We studied sleep in cry1,2-/- mice under baseline conditions as well as under conditions of constant darkness and enforced wakefulness to determine whether cryptochromes influence sleep regulatory processes.
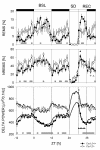
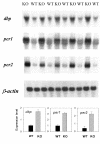
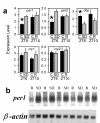
Results: Under all three conditions, cry1,2-/- mice exhibit the hallmarks of high non-REM sleep (NREMS) drive (i.e., increases in NREMS time, NREMS consolidation, and EEG delta power during NREMS). This unexpected phenotype was associated with elevated brain mRNA levels of period 1 and 2 (per1,2), and albumin d-binding protein (dbp), which are known to be transcriptionally inhibited by CRY1,2. To further examine the relationship between circadian genes and sleep homeostasis, we examined wild type mice and rats following sleep deprivation and found increased levels of per1,2 mRNA and decreased levels of dbp mRNA specifically in the cerebral cortex; these changes subsided with recovery sleep. The expression of per3, cry1,2, clock, npas2, bmal1, and casein-kinase-1epsilon did not change with sleep deprivation.
Conclusions: These results indicate that mice lacking cryptochromes are not simply a genetic model of circadian arrhythmicity in rodents and functionally implicate cryptochromes in the homeostatic regulation of sleep.
Figures
Figure 1
Time course of sleep (upper panels) and NREMS EEG delta power (lower panel). Data from baseline (BSL), sleep deprivation (SD), and recovery (REC) are shown. Open (_Cry1,2_-/-) and closed (Cry1,2+/+) symbols designate mean hourly values ± 1 SEM. In the lower panel, thicker lines connect mean predicted delta power values based on the sleep-wake distribution in individual mice; (see Methods). Triangles mark intervals in which recovery values differed from corresponding baseline values within each genotype (triangle orientation designates direction of deviation; P < 0.05, post-hoc paired t-tests). Gray bars at the bottom of each panel mark intervals with significant genotype differences (P < 0.05, post-hoc t-tests). The baseline dark period was depicted twice to illustrate the changes at the dark-to-light transition.
Figure 2
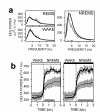
EEG power in the 1–20 Hz range for NREMS, REM sleep (REMS) and wake during baseline. (A) EEG spectral power in _cry1,2_-/- (thick lines) and wild type mice (thin lines). Differences between the genotypes are limited to NREMS delta power. (B) Delta power (1–4 Hz) during wake-to-NREMS transitions in the baseline light (left) and dark (right panel) period. Gray horizontal bars underneath the curves indicate significant genotype differences (P < 0.05; post-hoc t-tests). Error bars span ± 1 SEM.
Figure 3
Time course of sleep and NREMS EEG delta power during constant dark conditions (DD). Layout and symbols are same as in Figure 1. Gray bars at the bottom of each panel mark intervals with significant genotype differences (P < 0.05, post-hoc t-tests). The subjective day is marked with a gray horizontal bar at the top of the upper panel. The first 12-h represents the last dark-period under baseline (BSL) light-dark conditions.
Figure 4
Whole-brain mRNA levels for dbp, per1, and per2 in _cry1,2_-/- and wild type mice. Levels of all three genes are elevated in _cry1,2_-/- mice (KO) relative to wild type (WT) controls at ZT6 when dbp, per1, and per2 mRNAs are lowest in the forebrain of wild type mice [37]. In the lower three panels mean (± 1 SEM) expression levels are depicted. β-actin expression was used as an internal standard.
Figure 5
Sleep deprivation alters mRNA levels of per1, per2, and dbp. (A) RT-PCR analysis of the expression of five 'clock'-genes in the mouse cortex across four experimental conditions [C = control; R = recovery sleep; SD = sleep deprived; ZT = Zeitgeber time (i.e., 6 or 10 h after light-onset)]. g3pdh expression was used as an internal standard. Bars depict mean ± 1 SEM. Asterisks denote significant differences (P < 0.05) between the experimental and corresponding control group (Student-Newman-Keuls post-hoc tests; 1-way ANOVA factor 'condition': P < 0.05, for per1,2, and dbp only; n = 7/condition) (B) per1 mRNA falls significantly in rat cortex during a 2-h recovery period (R) subsequent to 6 h SD ending at ZT6 (P < 0.05, t-test). Northern analysis was performed on cortex of five sleep-deprived rats and five rats that were allowed 2 h of recovery sleep (ZT8).
Similar articles
- NPAS2: an analog of clock operative in the mammalian forebrain.
Reick M, Garcia JA, Dudley C, McKnight SL. Reick M, et al. Science. 2001 Jul 20;293(5529):506-9. doi: 10.1126/science.1060699. Epub 2001 Jul 5. Science. 2001. PMID: 11441147 - Sleep deprivation effects on circadian clock gene expression in the cerebral cortex parallel electroencephalographic differences among mouse strains.
Wisor JP, Pasumarthi RK, Gerashchenko D, Thompson CL, Pathak S, Sancar A, Franken P, Lein ES, Kilduff TS. Wisor JP, et al. J Neurosci. 2008 Jul 9;28(28):7193-201. doi: 10.1523/JNEUROSCI.1150-08.2008. J Neurosci. 2008. PMID: 18614689 Free PMC article. - Photoperiod differentially regulates clock genes' expression in the suprachiasmatic nucleus of Syrian hamster.
Tournier BB, Menet JS, Dardente H, Poirel VJ, Malan A, Masson-Pévet M, Pévet P, Vuillez P. Tournier BB, et al. Neuroscience. 2003;118(2):317-22. doi: 10.1016/s0306-4522(03)00008-3. Neuroscience. 2003. PMID: 12699768 - [Genetic regulation of circadian rhythms].
Tei H. Tei H. Tanpakushitsu Kakusan Koso. 2004 Feb;49(3 Suppl):456-62. Tanpakushitsu Kakusan Koso. 2004. PMID: 14976772 Review. Japanese. No abstract available. - Cryptochrome: the second photoactive pigment in the eye and its role in circadian photoreception.
Sancar A. Sancar A. Annu Rev Biochem. 2000;69:31-67. doi: 10.1146/annurev.biochem.69.1.31. Annu Rev Biochem. 2000. PMID: 10966452 Review.
Cited by
- Circadian Clock Dysfunction and Psychiatric Disease: Could Fruit Flies have a Say?
Zordan MA, Sandrelli F. Zordan MA, et al. Front Neurol. 2015 Apr 20;6:80. doi: 10.3389/fneur.2015.00080. eCollection 2015. Front Neurol. 2015. PMID: 25941512 Free PMC article. Review. - Altered circadian and homeostatic sleep regulation in prokineticin 2-deficient mice.
Hu WP, Li JD, Zhang C, Boehmer L, Siegel JM, Zhou QY. Hu WP, et al. Sleep. 2007 Mar;30(3):247-56. Sleep. 2007. PMID: 17425220 Free PMC article. - Parent-of-origin genetic background affects the transcriptional levels of circadian and neuronal plasticity genes following sleep loss.
Tinarelli F, Garcia-Garcia C, Nicassio F, Tucci V. Tinarelli F, et al. Philos Trans R Soc Lond B Biol Sci. 2014 Jan 20;369(1637):20120471. doi: 10.1098/rstb.2012.0471. Print 2014 Mar 5. Philos Trans R Soc Lond B Biol Sci. 2014. PMID: 24446504 Free PMC article. - Sleep homeostasis and the circadian clock: Do the circadian pacemaker and the sleep homeostat influence each other's functioning?
Deboer T. Deboer T. Neurobiol Sleep Circadian Rhythms. 2018 Mar 1;5:68-77. doi: 10.1016/j.nbscr.2018.02.003. eCollection 2018 Jun. Neurobiol Sleep Circadian Rhythms. 2018. PMID: 31236513 Free PMC article. Review. - The circadian clock gene Csnk1e regulates rapid eye movement sleep amount, and nonrapid eye movement sleep architecture in mice.
Zhou L, Bryant CD, Loudon A, Palmer AA, Vitaterna MH, Turek FW. Zhou L, et al. Sleep. 2014 Apr 1;37(4):785-93, 793A-793C. doi: 10.5665/sleep.3590. Sleep. 2014. PMID: 24744456 Free PMC article.
References
- Klein DC, Moore RY, Reppert SM. Suprachiasmatic nucleus: The mind's clock. New York: Oxford University Press. 1991.
- Edgar DM. Functional role of the suprachiasmatic nuclei in the regulation of sleep and wakefulness. In: Guilleminault C, editor. Fatal Familial Insomnia: Inherited prion diseases, sleep and the thalamus. New York: Raven Press, Ltd; 1994. pp. 203–213.
- Borbely AA, Achermann P. Sleep homeostasis and models of sleep regulation. In: Kryger MH, Roth T, Dement WC, editor. Principles and practice in sleep medicine. 3rd. Philadelphia: W.B. Saunders; 2000. pp. 377–390.
Publication types
MeSH terms
Substances
Grants and funding
- HL64243/HL/NHLBI NIH HHS/United States
- R01MH61755/MH/NIMH NIH HHS/United States
- R01HL/MH59658/HL/NHLBI NIH HHS/United States
- HL64148/HL/NHLBI NIH HHS/United States
- GM31082/GM/NIGMS NIH HHS/United States
- R37 GM031082/GM/NIGMS NIH HHS/United States
- R01 GM031082/GM/NIGMS NIH HHS/United States
- DA13349/DA/NIDA NIH HHS/United States
- R01 MH061755/MH/NIMH NIH HHS/United States
LinkOut - more resources
Full Text Sources
Other Literature Sources
Molecular Biology Databases


