Diversity at the locus associated with transcription of a variable surface antigen of Pneumocystis carinii as an index of population structure and dynamics in infected rats - PubMed (original) (raw)
Diversity at the locus associated with transcription of a variable surface antigen of Pneumocystis carinii as an index of population structure and dynamics in infected rats
Scott P Keely et al. Infect Immun. 2003 Jan.
Abstract
Pneumocystis carinii expresses a surface glycoprotein called MSG. Different isoforms of MSG are encoded by a gene family spread over at least 15 telomeric sites. Only one locus, called UCS, supports the production of MSG mRNA. Previous studies showed that P. carinii populations from individual rats exhibited high degrees of diversity with respect to the MSG genes attached to the UCS locus. This diversity could have been generated primarily in the rats studied. Alternatively, the rats may have been infected by P. carinii organisms that were already different at the UCS locus. To investigate this issue, we examined the UCS locus in P. carinii from rats that had been exposed to few of the microbes at a specified time, which produced a bottleneck in the microbial population. Some of the rats with bottlenecks produced P. carinii populations in which a single MSG sequence resided at the UCS locus in 80 to 90% of the organisms, showing that P. carinii can proliferate within a rat without generating the very high levels of UCS diversity previously seen. From the degree of diversity observed in the bottlenecked populations, the maximum rate of switching appeared to be 0.01 event per generation. These data also suggest that the infectious dose is as low as one organism, that rats that share a cage readily infect each other, and that the doubling time of P. carinii in vivo is approximately 3 days. In addition, we found that inoculation with 10(7) P. carinii organisms from a population highly heterogeneous at the UCS locus reproduced this heterogeneity. By contrast, shifts in population structure occurred in rats given 10(4) P. carinii organisms, suggesting that a small fraction of these proliferated.
Figures
FIG. 1.
Map of the UCS-MSG locus and locations of PCR primers. The UCS region of the locus is invariant and marks a unique telomeric site in the genome. Adjacent to the UCS, there is always a sequence encoding a protein called MSG. The MSG gene sequence at the UCS locus can be different in different organisms, presumably because recombination installs different MSG-encoding sequences at the UCS locus. The genome carries many copies of MSG-encoding sequences, which reside at the ends of all chromosomes and differ from one another. Only the MSG-encoding sequence that is linked to the UCS locus is represented by mRNA. The CRJE is a 25-bp conserved sequence located between the UCS and its adjacent MSG gene. A copy of the CRJE is also at the beginning of all known MSG-encoding sequences not attached to the UCS locus.
FIG. 2.
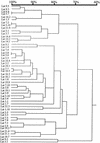
Relatedness of MSG genes adjacent to the UCS locus in populations of P. carinii from latently infected rats. MSG gene sequences were aligned by pairwise comparisons. The horizontal branch lengths represent divergence, and the bar above the dendrogram shows percent identity.
FIG. 3.
Sizes of UCS-MSG amplicons from rats inoculated with different doses of P. carinii. UCS-MSG junctions were amplified from genomic DNA extracted from different P. carinii populations. The radiolabeled amplicons were separated by electrophoresis through 4% acrylamide. Lanes 1 and 20, template DNA from the population from which inocula were drawn. The dots in lane 1 indicate the 10 strongest bands in the input pattern. Lanes 2 to 5, 6 to 10, and 11 to 19, template DNAs from rats inoculated with 101, 104, and 107 organisms, respectively. The DNA bands in lanes 2, 3, 4, and 5 were produced from animals 267, 268, 271, and 272. The arrowhead next to lane 6 marks band 8, which was one of several bands that varied in intensity among the rats inoculated with 104 organisms. The band in lane 21 was generated by amplification from a plasmid containing a single UCS-MSG junction. The numbers on the left are DNA sizes in base pairs.
FIG. 4.
Sizes of UCS-MSG amplicons produced from control plasmids. UCS-MSG junctions were amplified from six plasmids, each of which carried a different sequence. The radiolabeled amplicons were separated by electrophoresis through 4% acrylamide. Lanes 1 to 6, amplicons from six different plasmids, each carrying a different UCS-MSG junction. On the right are DNA sizes in base pairs.
FIG. 5.
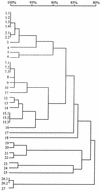
Relatedness of MSG genes adjacent to the UCS locus in the population of P. carinii used to prepare inocula. Inserts in 36 plasmids carrying UCS-MSG junctions amplified from the input population were sequenced. Twenty-seven different sequences were present. Five sequences were present in more than one plasmid. These are numbered, e.g., 1.1 and 1.2. The sequences were aligned by pairwise comparisons, and percent identities were calculated. These are displayed in the dendrogram. The horizontal branch lengths represent divergence, and the bar above the dendrogram shows percent identity. To illustrate, sequences and 17 and 18 differed by ∼17%. Sequence 13 matched that predominant in inoculated rats 271 and 272. Sequence 23 matched 13, which matched that predominant in inoculated rats 273 and 274. The sequence in plasmids 15.1, 15.2, and 15.3 was the same as that seen in inoculated rat 267.
FIG. 6.
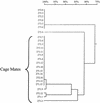
Relatedness of UCS-linked MSG genes from rats inoculated with 10 P. carinii organisms and housed either together or separately. Twenty-five plasmids carrying UCS-MSG junctions amplified from three rats (271 and 272, which were cagemates, and 273, which was housed in a different cage) were aligned by pairwise comparisons. Percent identities were calculated and are displayed as a dendrogram. The horizontal branch lengths represent divergence, and the bar above the dendrogram shows percent identity. To illustrate, sequences 271.1 and 271.2 differed by ∼17%.
FIG. 7.
Alignment of two UCS-linked MSG genes from rat 271. The sequence labeled 271.12 was in six of eight sequenced plasmids produced by cloning the amplicons from rat 271. Sequence 271.1 was in one of these plasmids. In both sequences, the first 25 bases are the CRJE (44), which is a conserved sequence found at the beginning of all known MSG genes and at all known USC-MSG junctions. The dots represent identity, and the dashes represent gaps introduced to optimize the number of matches. The number at the end of each line of sequence indicates the number of nucleotides from the beginning of that sequence. The two sequences differ at 54 positions (17%).
Similar articles
- Residence at the expression site is necessary and sufficient for the transcription of surface antigen genes of Pneumocystis carinii.
Sunkin SM, Stringer JR. Sunkin SM, et al. Mol Microbiol. 1997 Jul;25(1):147-60. doi: 10.1046/j.1365-2958.1997.4461806.x. Mol Microbiol. 1997. PMID: 11902717 - Translocation of surface antigen genes to a unique telomeric expression site in Pneumocystis carinii.
Sunkin SM, Stringer JR. Sunkin SM, et al. Mol Microbiol. 1996 Jan;19(2):283-95. doi: 10.1046/j.1365-2958.1996.375905.x. Mol Microbiol. 1996. PMID: 8825774 - The major surface glycoprotein expression sites of two special forms of rat Pneumocystis carinii differ in structure.
Schaffzin JK, Stringer JR. Schaffzin JK, et al. J Infect Dis. 2000 May;181(5):1729-39. doi: 10.1086/315438. Epub 2000 May 15. J Infect Dis. 2000. PMID: 10823775 - Antigenic variation in pneumocystis.
Stringer JR. Stringer JR. J Eukaryot Microbiol. 2007 Jan-Feb;54(1):8-13. doi: 10.1111/j.1550-7408.2006.00225.x. J Eukaryot Microbiol. 2007. PMID: 17300510 Review. - Genetics of surface antigen expression in Pneumocystis carinii.
Stringer JR, Keely SP. Stringer JR, et al. Infect Immun. 2001 Feb;69(2):627-39. doi: 10.1128/IAI.69.2.627-639.2001. Infect Immun. 2001. PMID: 11159949 Free PMC article. Review.
Cited by
- Axenic Long-Term Cultivation of Pneumocystis jirovecii.
Riebold D, Mahnkopf M, Wicht K, Zubiria-Barrera C, Heise J, Frank M, Misch D, Bauer T, Stocker H, Slevogt H. Riebold D, et al. J Fungi (Basel). 2023 Sep 1;9(9):903. doi: 10.3390/jof9090903. J Fungi (Basel). 2023. PMID: 37755011 Free PMC article. - Antigenic and phenotypic variations in fungi.
Jain N, Fries BC. Jain N, et al. Cell Microbiol. 2009 Dec;11(12):1716-23. doi: 10.1111/j.1462-5822.2009.01384.x. Epub 2009 Sep 21. Cell Microbiol. 2009. PMID: 19769677 Free PMC article. Review. - Multilocus microsatellite genotyping array for investigation of genetic epidemiology of Pneumocystis jirovecii.
Parobek CM, Jiang LY, Patel JC, Alvarez-Martínez MJ, Miro JM, Worodria W, Andama A, Fong S, Huang L, Meshnick SR, Taylor SM, Juliano JJ. Parobek CM, et al. J Clin Microbiol. 2014 May;52(5):1391-9. doi: 10.1128/JCM.02531-13. Epub 2014 Feb 12. J Clin Microbiol. 2014. PMID: 24523468 Free PMC article. - The frequency and rate of pilin antigenic variation in Neisseria gonorrhoeae.
Criss AK, Kline KA, Seifert HS. Criss AK, et al. Mol Microbiol. 2005 Oct;58(2):510-9. doi: 10.1111/j.1365-2958.2005.04838.x. Mol Microbiol. 2005. PMID: 16194236 Free PMC article. - Pneumocystis murina MSG gene family and the structure of the locus associated with its transcription.
Keely SP, Linke MJ, Cushion MT, Stringer JR. Keely SP, et al. Fungal Genet Biol. 2007 Sep;44(9):905-19. doi: 10.1016/j.fgb.2007.01.004. Epub 2007 Jan 10. Fungal Genet Biol. 2007. PMID: 17320432 Free PMC article.
References
- Aliouat, E. M., R. Escamilla, C. Cariven, C. Vieu, C. Mullet, E. Dei-Cas, and M. C. Prevost. 1998. Surfactant changes during experimental pneumocystosis are related to Pneumocystis development. Eur. Respir. J. 11:542-547. - PubMed
- Anonymous. 1994. Revised nomenclature for Pneumocystis carinii. The Pneumocystis Workshop. J. Eukaryot. Microbiol. 41:121S-122S. - PubMed
- Armstrong, M. Y., and M. T. Cushion. 1994. Animal models, p. 181-222. In P. D. Walzer (ed.), Pneumocystis carinii pneumonia. Marcel Dekker, New York, N.Y.
Publication types
MeSH terms
Substances
LinkOut - more resources
Full Text Sources


