Cathepsin A regulates chaperone-mediated autophagy through cleavage of the lysosomal receptor - PubMed (original) (raw)
Cathepsin A regulates chaperone-mediated autophagy through cleavage of the lysosomal receptor
Ana Maria Cuervo et al. EMBO J. 2003.
Abstract
Protective protein/cathepsin A (PPCA) has a serine carboxypeptidase activity of unknown physiological function. We now demonstrate that this protease activity triggers the degradation of the lysosome-associated membrane protein type 2a (lamp2a), a receptor for chaperone-mediated autophagy (CMA). Degradation of lamp2a is important because its level in the lysosomal membrane is a rate-limiting step of CMA. Cells defective in PPCA show reduced rates of lamp2a degradation, higher levels of lamp2a and higher rates of CMA. Restoration of PPCA protease activity increases rates of lamp2a degradation, reduces levels of lysosomal lamp2a and reduces rates of CMA. PPCA associates with lamp2a on the lysosomal membrane and cleaves lamp2a near the boundary between the luminal and transmembrane domains. In addition to the well-studied role of PPCA in targeting and protecting two lysosomal glycosidases, we have defined a role for the proteolytic activity of this multifunctional protein.
Figures
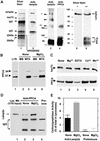
Fig. 1. PPCA associates with lamp2a in rat liver lysosomes. (A) Solubilized lysosomes cross-linked with DSP were subjected to affinity chromato graphy with the antibody against the cytosolic tail of lamp2a (lanes 1 and 2). Eluted proteins were subjected to SDS–PAGE and silver stained (lane 1), or immunoblotted for lamp2a (lane 2). The sequence of the N-terminus of the 32 kDa band is shown. Part of the solubilized lysosomes were directly subjected to non-reducing SDS–PAGE (5%) and immunoblotted for lamp2a (lane 3) or PPCA (lane 4). Arrowheads indicate lamp2a multimeric complexes. The 600 kDa (*) and 200 kDa (**) molecular weight complexes of lamp2a were excised and subjected to reducing SDS–PAGE (12%) and silver staining (lanes 5 and 6). Molecular weight (kDa) is indicated on the left. (B) Immunoblot analysis of PPCA in rat liver lysosomes, their membranes (MB) and matrices (MTX) (100 µg of protein) incubated alone (None) or with 5 mM MgCl2. Arrowheads indicate the precursor (54 kDa) and heavy chain (32 kDa) of the mature PPCA. (C) Immunoblot analysis of hsc73 (upper) and PPCA (lower) in membranes from rat liver lysosomes incubated alone (None) or with 5 mM MgCl2, CaCl2, MnCl2 or 2 mM EDTA. (D) Immunoblot analysis of lamp2a co-immunoprecipitated with PPCA in the absence of chemical cross-linkers from membranes of liver lysosomes incubated as in (B). Light and heavy chains of IgG are shown. Lane 1 contains 1/10 of the total amount of lysosomal membranes used for immunoprecipitation. (E) Membranes from lysosomes treated as in (D) were subjected to immunoprecipitation with an antibody specific for lamp2a or with a pre-immune serum. Carboxypeptidase activity in total lysosomes and in the immunoprecipitates was measured as described under Materials and methods. Values are expressed as percentage of total carboxypeptidase activity in lysosomes present in the immunoprecipitates and are the mean ± SE of three different experiments.
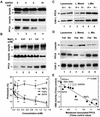
Fig. 2. Levels of PPCA associated with the lysosomal membrane correlate with rates of CMA. Membranes of lysosomes incubated with increasing concentrations of GAPDH (A) or MgCl2 (B, top panel) as labeled, were analyzed by immunoblot for all forms of lamp2 (upper), lamp2a (middle) or PPCA (lower). The arrowhead indicates a previously identified truncated form of lamp2 lacking the cytosolic/transmembrane region (Cuervo and Dice, 2000b). (B, bottom panel) Chart showing the effect of increasing concentrations of MgCl2, CaCl2 or EDTA on the degradation of [14C]GAPDH by intact rat liver lysosomes. Values are means ± SE of six different experiments. Differences from the control value were significant at P < 0.001 (**) or P < 0.01 (*). (C) Immunoblot analysis for PPCA (upper) and cathepsin L (lower) of rat liver lysosomes (100 µg of protein) with high (H+) and low (H–) activity for CMA and of the lysosomal membranes (L.Memb) and matrices (L.Mtx) from both groups of lysosomes (200 µg of protein). (D) Immunoblot analysis for lamp2a, PPCA and cathepsin D, as labeled, of lysosomes (100 µg of protein) from fed or 48 h starved rats and the membranes (L. Memb) and matrices (L. Mtx) of both goups of lysosomes (200 µg of protein). Only mature forms of the cathepsins are shown. (E) Correlation between CMA activity, measured as in (B, bottom panel) and levels of PPCA at the lysosomal membrane determined by denstometric quantification of immunoblots similar to those shown in Figures 1 and 2 in lysosomes from fed or 20 h starved rats (Starv 20h), highly active (H+) or less active (H–) lysosomes, or lysosomes incubated with 1 mM CaCl2, MgCl2, EDTA, or increasing amounts (2, 5, 10 µg) of GAPDH. Values are expressed as times the value in fed rats (control) and are means ± SE of 3–6 different experiments.
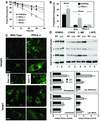
Fig. 3. CMA is abnormally activated in PPCA-deficient fibroblasts. (A) Rates of protein degradation in skin fibroblasts from wild-type (control) or PPCA(–/–) mice maintained in the presence (serum +) or absence of serum (serum –). Values are expressed as the percentage of initially radiolabeled proteins remaining at each time and are means ± SE of four different experiments. (B) Degradation of [14C]GAPDH after 30 min incubation with lysosomes isolated from wild-type and PPCA(–/–) mice skin fibroblasts supplemented or deprived of serum was measured as described in Material and methods. Where indicated, 25 µg of RNase A were added. Values are means ± SE of four different experiments. Differences from the control value were significant to P < 0.001 (**). (C) Immunofluorescent staining for lamp2a and lamp1 of skin fibroblasts from wild-type and PPCA(–/–) mice. Gain for lamp2a images (top) was 1/8 of the one for lamp1 (bottom) to visualize the punctate pattern of lamp2a in PPCA(–/–) mice. Inset: detail of the vesicular distribution of lamp2a. The gain in wild type was eight times the gain in PPCA(–/–) mice). Bars: 100 µm (top), 50 µm (bottom), 10 µm (inset). (D) Immunoblot analysis for lamp2a, all lamp2s, lamp1 or cathepsin D (cath D) of homogenates (75 µg of protein), lysosomes (10 µg of protein) and lysosomal membranes (L.MB) and matrices (L.MTX) (5 µg of protein) isolated from wild-type (WT) and PPCA(–/–) skin fibroblasts. The bottom chart shows the densitometric quantification of the membrane proteins (means + SE) from four immunoblots similar to those shown here. Differences from the control value were significant to P < 0.001 (**) and P < 0.05 (*).
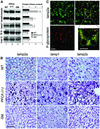
Fig. 4. Lamps levels in livers from PPCA(–/–) mice. (A) Immunoblot analysis for lamp2a, all lamp2s, lamp1, transferrin receptor (TFR) or cathepsin D (cath D) of liver homogenates (100 µg of protein) from wild-type (WT), PPCA(–/–) and β-galactosidase(–/–) (GM) mice. Right: densitometric quantification of three immunoblots (means + SE) similar to the ones shown here. Differences from the control value were significant to P < 0.001 (**) and P < 0.05 (*). (B) Immunocytochemistry for lamp2a (left), lamp1 (center) or lamp2s (right) in hematoxylin and eosin-stained sections from the same livers. Bar: 50 µm. Black arrows: hepatocytes; white arrows: Kupffer cells. (C) Immunofluorescence for lamp2a (top) and P-glycoprotein (bottom) in mouse liver sections. The right panel shows merged images. Bar: 100 µm. Inset shows detailed area at higher magnification. Bar: 50 µm.
Fig. 5. Impaired lamp2a degradation in PPCA-deficient fibroblasts. (A) Autofluorography of the sequential immunoprecipitation of lamp2a first (left) and all the remaining isoforms of lamp2 second (right) from metabolically labeled wild-type and PPCA(–/–) mouse skin fibroblasts. Values are means ± SE of three different experiments similar to the ones shown in the upper panels. (B) Immunoblot analysis for lamp2a (top) and all lamp2 isoforms (bottom) in lysosomal membranes from wild-type (WT) or PPCA(–/–) mouse skin fibroblasts at different times after incubation at 37°C. The open arrowhead indicates the truncated form of lamp2 lacking the cytosolic/transmembrane region (Cuervo and Dice, 2000b). Right shows the densitometric quantification (mean ± SE) of four different experiments similar to the one shown here. Values are expressed as percentage of remaining lamp2a, and are means ± 1 SE of three different experiments.
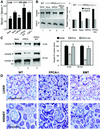
Fig. 6. Restoration of PPCA protease activity in GS cells normalizes CMA. (A) Rates of total protein degradation in the presence and absence of serum of normal skin fibroblasts (CTR), GS cells (None) and GS cells supplemented with the precursor forms of native PPCA (+PPCA), a catalytic mutant of PPCA (+PPCA S/A) or cathepsin L (Cath L). Values are means ± SE of six different experiments. Differences from the control value were significant for P < 0.001 (**) and P < 0.05 (*). (B) Immunoblot analysis for lamp2a and cathepsin D (Cath D) of homogenates of wild-type and PPCA(–/–) cells supplemented as in (A). Right: densitometric quantification (means + range of values) of two experiments similar to the one shown. Values are expressed as times the value in wild-type cells. (C) Immunoblot analysis for lamp2a at time 0 or after 40 min incubation at 37°C of lysosomes isolated from PPCA(–/–) cells (None) and PPCA(–/–) cells supplemented as in (A). At 40 min immunoblot with the antibody against the luminal region of lamp2a is depicted to show the truncated form of lamp2a (open arrowhead). Right: densitometric quantification for lamp2a (means + range of values) of two different experiments similar to the one shown. Values are expressed as percentage of the lamp2a present in non-supplemented cells. (D) Immunocytochemistry for lamp2a of liver (top) and kidney (bottom) sections of age-matched wild-type (WT), PPCA(–/–) and bone marrow transplanted (BMT) mice. Bar, 50 µm (liver) or 100 µm (kidney).
Fig. 7. Cleavage site of PPCA in lamp2a. (A) Left: amino acid sequences of the C-terminal regions of lamp2a from different species and of other lamp2 isoforms and lamp1 from mouse. The proposed cleavage site for PPCA in lamp2a is highlighted. Right: immunoblot analysis for HA of lysosomal membranes isolated from two different clones of HEK293 (mouse; upper panel) and NIH 3T3 cells (human; lower panel) stably transfected with wild-type (FL) and mutated (GL) HA-lamp2a. The arrowhead indicates the truncated form of lamp2 lacking the cytosolic/transmembrane region. (B) Total rates of protein degradation in the presence and absence of serum in non-transfected HEK293 cells (WT) and in the transfected HEK293 clones described in (A). Values are expressed as the percentage of initially radiolabeled proteins remaining at each time and are means ± SE of three different experiments. (C) Top: immunoblot analysis with an anti-HA antibody of purified wild-type (FL) and mutated (GL) mouse HA-lamp2a incubated in an acidic pH buffer alone, or with PPCA. Bottom: wild-type HA-lamp2a was incubated as in the top panel without additions (None) or in the presence of 2 mM EDTA, 10 µM
l
-_trans_-epoxysuccinyl-leucylamide-(4-guanido)-butane (E-64), 2 µM pepstatin A (Pepst) or 10 µM ABSF. The open arrowhead indicates the truncated form of lamp2a.
Fig. 8. Hypothetical model for the regulation of CMA by PPCA. Under normal nutritional conditions (FED, left), binding of PPCA to the lysosomal membrane might trigger cleavage of lamp2a by an unidentified metalloprotease (at the transmembrane region) (1) and by PPCA (at the intersection between the transmembrane and luminal regions) (see inset). That cleavage releases a truncated lamp2a into the matrix (2), where it is completely degraded by the lysosomal proteases (3). During starvation (right), PPCA dissociates from the lysosomal membrane (1) so that lamp2a is not longer degraded and remains in the membrane, accessible for substrate binding (2) and uptake into the lysosomes (3).
Similar articles
- Lysosome membrane lipid microdomains: novel regulators of chaperone-mediated autophagy.
Kaushik S, Massey AC, Cuervo AM. Kaushik S, et al. EMBO J. 2006 Sep 6;25(17):3921-33. doi: 10.1038/sj.emboj.7601283. Epub 2006 Aug 17. EMBO J. 2006. PMID: 16917501 Free PMC article. - Regulation of lamp2a levels in the lysosomal membrane.
Cuervo AM, Dice JF. Cuervo AM, et al. Traffic. 2000 Jul;1(7):570-83. doi: 10.1034/j.1600-0854.2000.010707.x. Traffic. 2000. PMID: 11208145 - Unique properties of lamp2a compared to other lamp2 isoforms.
Cuervo AM, Dice JF. Cuervo AM, et al. J Cell Sci. 2000 Dec;113 Pt 24:4441-50. doi: 10.1242/jcs.113.24.4441. J Cell Sci. 2000. PMID: 11082038 - Mechanisms of chaperone-mediated autophagy.
Majeski AE, Dice JF. Majeski AE, et al. Int J Biochem Cell Biol. 2004 Dec;36(12):2435-44. doi: 10.1016/j.biocel.2004.02.013. Int J Biochem Cell Biol. 2004. PMID: 15325583 Review. - Chaperone-mediated autophagy.
Dice JF. Dice JF. Autophagy. 2007 Jul-Aug;3(4):295-9. doi: 10.4161/auto.4144. Epub 2007 Jul 15. Autophagy. 2007. PMID: 17404494 Review.
Cited by
- Lysosome membrane lipid microdomains: novel regulators of chaperone-mediated autophagy.
Kaushik S, Massey AC, Cuervo AM. Kaushik S, et al. EMBO J. 2006 Sep 6;25(17):3921-33. doi: 10.1038/sj.emboj.7601283. Epub 2006 Aug 17. EMBO J. 2006. PMID: 16917501 Free PMC article. - Cathepsins mediate tumor metastasis.
Tan GJ, Peng ZK, Lu JP, Tang FQ. Tan GJ, et al. World J Biol Chem. 2013 Nov 26;4(4):91-101. doi: 10.4331/wjbc.v4.i4.91. World J Biol Chem. 2013. PMID: 24340132 Free PMC article. Review. - Lysosome associated membrane proteins maintain pancreatic acinar cell homeostasis: LAMP-2 deficient mice develop pancreatitis.
Mareninova OA, Sendler M, Malla SR, Yakubov I, French SW, Tokhtaeva E, Vagin O, Oorschot V, Lüllmann-Rauch R, Blanz J, Dawson D, Klumperman J, Lerch MM, Mayerle J, Gukovsky I, Gukovskaya AS. Mareninova OA, et al. Cell Mol Gastroenterol Hepatol. 2015 Nov 1;1(6):678-694. doi: 10.1016/j.jcmgh.2015.07.006. Cell Mol Gastroenterol Hepatol. 2015. PMID: 26693174 Free PMC article. - Humanin is an endogenous activator of chaperone-mediated autophagy.
Gong Z, Tasset I, Diaz A, Anguiano J, Tas E, Cui L, Kuliawat R, Liu H, Kühn B, Cuervo AM, Muzumdar R. Gong Z, et al. J Cell Biol. 2018 Feb 5;217(2):635-647. doi: 10.1083/jcb.201606095. Epub 2017 Nov 29. J Cell Biol. 2018. PMID: 29187525 Free PMC article. - Expression of Autophagy Markers LC3B, LAMP2A, and GRP78 in the Human Kidney during Embryonic, Early Fetal, and Postnatal Development and Their Significance in Diabetic Kidney Disease.
Brdar I, Racetin A, Jeličić I, Vukojević K, Vučković L, Ljutić D, Saraga-Babić M, Filipović N. Brdar I, et al. Int J Mol Sci. 2024 Aug 23;25(17):9152. doi: 10.3390/ijms25179152. Int J Mol Sci. 2024. PMID: 39273100 Free PMC article.
References
- Akiyama T., Kihara,A., Tokuda,H. and Ito,K. (1996) FtsH (HflB) is an ATP-dependent protease selectively acting on SecY and some other membrane proteins. J. Biol. Chem., 271, 31196–31201. - PubMed
- Auteri J.S. et al. (1983) Regulation of intracellular protein degradation in IMR-90 human diploid fibroblasts. J. Cell Physiol., 115, 159–166. - PubMed
- Bonten E.J., Galjart,N.J., Willemsen,R., Usmany,M., Vlak,J.M. and d’Azzo,A. (1995) Lysosomal protective protein/cathepsin A. Role of the ‘linker’ domain in catalytic activation. J. Biol. Chem., 270, 26441–26445. - PubMed
- Chiang H.L., Terlecky,S.R., Plant,C.P. and Dice,J.F. (1989) A role for a 70-kilodalton heat shock protein in lysosomal degradation of intracellular proteins. Science, 246, 382–385. - PubMed
Publication types
MeSH terms
Substances
Grants and funding
- Z01 DK052025/ImNIH/Intramural NIH HHS/United States
- DK52025/DK/NIDDK NIH HHS/United States
- AG00829/AG/NIA NIH HHS/United States
- R01 DK052025/DK/NIDDK NIH HHS/United States
- R37 AG006116/AG/NIA NIH HHS/United States
- AG06116/AG/NIA NIH HHS/United States
- R01 AG006116/AG/NIA NIH HHS/United States
LinkOut - more resources
Full Text Sources
Other Literature Sources
Molecular Biology Databases
