Growth suppression of pre-T acute lymphoblastic leukemia cells by inhibition of notch signaling - PubMed (original) (raw)
Growth suppression of pre-T acute lymphoblastic leukemia cells by inhibition of notch signaling
Andrew P Weng et al. Mol Cell Biol. 2003 Jan.
Abstract
Constitutive NOTCH signaling in lymphoid progenitors promotes the development of immature T-cell lymphoblastic neoplasms (T-ALLs). Although it is clear that Notch signaling can initiate leukemogenesis, it has not previously been established whether continued NOTCH signaling is required to maintain T-ALL growth. We demonstrate here that the blockade of Notch signaling at two independent steps suppresses the growth and survival of NOTCH1-transformed T-ALL cells. First, inhibitors of presenilin specifically induce growth suppression and apoptosis of a murine T-ALL cell line that requires presenilin-dependent proteolysis of the Notch receptor in order for its intracellular domain to translocate to the nucleus. Second, a 62-amino-acid peptide derived from a NOTCH coactivator, Mastermind-like-1 (MAML1), forms a transcriptionally inert nuclear complex with NOTCH1 and CSL and specifically inhibits the growth of both murine and human NOTCH1-transformed T-ALLs. These studies show that continued growth and survival of NOTCH1-transformed lymphoid cell lines require nuclear access and transcriptional coactivator recruitment by NOTCH1 and identify at least two steps in the Notch signaling pathway as potential targets for chemotherapeutic intervention.
Figures
FIG. 1.
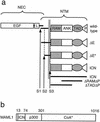
(a) Schematic representation of various forms of NOTCH referred to in this study. The normal mature heterodimeric receptor is produced by cleavage at S1. Cleavages at S2 and S3 are normally regulated by ligand binding to NEC but occur constitutively in the case of the ΔE form. Cleavage of ΔE at S2 by a metalloprotease yields the ΔE* form. Cleavage of ΔE* at S3 by presenilins releases ICN from the membrane. ICN1 constructs utilized in T6E/DFP-AA rescue experiments are indicated (ICN, ΔRAMΔP, and ΔTADΔP). P, PEST domain. (b) Schematic representation of functional domains of MAML1. Amino acid residue positions are indicated; 1016 represents full-length MAML1. ICN, Notch-binding domain; p300, p300 recruitment domain according to Fryer et al. (20); CoA*, recruitment domain for unidentified transcriptional coactivator(s).
FIG. 2.
Potency of presenilin inhibitor compounds in suppression of transcriptional stimulation by ΔE. U2OS cells were transiently transfected with a ΔE expression construct along with a CSL-luciferase reporter. Average normalized luciferase reporter activity (± standard deviations) from triplicate samples is expressed as a percentage of that observed in mock-treated cells.
FIG. 3.
Suppression of T6E cell growth by the presenilin inhibitor compound DFP-AA. T6E (left panel) and I22 (right panel) cells were cultured in the presence of the indicated concentrations of DFP-AA or carrier (mock) and were counted daily. Extrapolated cell counts were calculated as described in Materials and Methods.
FIG. 4.
Presenilin inhibitor treatment alters cell cycle progression and induces apoptosis in T6E, but not I22, cells. (a and b) Cell cycle analysis. T6E and I22 cells were treated with the indicated concentrations of DFP-AA for 3 and 8 days, respectively. DNA content was measured by flow cytometry after staining with propidium iodide. (a) Representative propidium iodide (PI) fluorescence histograms with superimposed cell cycle analysis models (including background correction). (b) Cell cycle fractions determined from histograms as for panel a. (c and d) Apoptosis analysis. (c) Sub-G1 fractions determined by using histograms as for panel a. (d) T6E and I22 cells treated with DFP-AA for 8 days were dual-stained with Annexin-V (for apoptotic cells) and 7-ADD (to exclude dead cells) and were analyzed by flow cytometry. Percentages of apoptotic cells (Annexin-V+/7-AAD−) are indicated after excluding cell debris by forward/side scatter gating.
FIG. 5.
Leukemogenic forms of ICN1 rescue T6E cells from presenilin inhibitor-mediated growth suppression. (a) Growth advantage of ICN1-transduced cells under conditions of presenilin inhibitor treatment. T6E cells were transduced with retroviruses encoding various constitutively nuclear forms of NOTCH1 (shown in Fig. 1a) and GFP on a bicistronic mRNA or GFP alone and then were treated with 1 μM DFP-AA or carrier (mock) beginning at day 3 posttransduction and continuing for the duration of the experiment. The percentage of GFP+ cells in each of the cultures was determined daily by flow cytometry, gating for live cells by forward/side scatter criteria. All cultures were repeated in duplicate; a single representative experiment is shown. (b) Cell cycle analysis. T6E cells from the experiment depicted in panel a were harvested after 9 days of exposure to 1 μM DFP-AA or carrier (mock) and were stained with DRAQ5 dye. DNA content was measured by DRAQ5 fluorescence in GFP− and GFP+ subpopulations by flow cytometry.
FIG. 6.
Presenilin inhibitor treatment blocks NOTCH1 signal transduction in T6E, but not I22, cells. (a) Effects on NOTCH1 polypeptides. T6E and I22 cells were treated with 1 μM DFP-AA for the indicated periods of time. NOTCH1 polypeptides were then immunoprecipitated from whole-cell extracts with an antibody directed against the intracellular domain of NOTCH1 (α-TC) and were analyzed on a Western blot stained with α-TC. ΔE, ΔE*, and ICN are NOTCH1-derived polypeptides diagrammed in Fig. 1. (b) Effects on HES1 transcript level. After T6E and I22 cells were treated with 1 μM DFP-AA for the indicated periods of time, total RNA was collected and analyzed on a Northern blot with probes for HES1 and GAPDH.
FIG. 7.
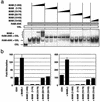
Mapping and functional characterization of dominant-negative MAML1 peptides. (a) Mapping MAML1 residues needed for ternary complex formation. Highly purified MAML1 peptides incubated with recombinant ICN1 RAM-ANK and immunopurified CSL were scored for complex formation in an EMSA. MAML1 peptides were included at increasing concentrations of up to a fivefold molar excess over the concentration of RAM-ANK. (b) Dominant-negative activities of MAML1 peptides. Each well of a 24-well plate containing U2OS cells was transiently transfected with pcDNA3 expression constructs for ICN1 (10 ng), various MAML1 peptides (50 ng), a CSL-luciferase reporter (125 ng), and a Renilla luciferase internal control reporter (2.5 ng). Mean normalized luciferase activity (± standard deviations) from triplicate wells is expressed relative to that observed in cells transfected with reporter constructs plus empty pcDNA3 (60 ng).
FIG. 8.
Dominant-negative MAML1 peptides specifically suppress growth of human and murine NOTCH1-transformed T-cell lines. (a) Growth suppression of cells expressing the dominant-negative MAML1(13-74)-GFP fusion protein. Each cell line was transduced with MAML1(13-74)-GFP or GFP retrovirus at titers such that only a subpopulation of cells (∼40 to 70%) were transduced. The percentage of GFP+ cells was determined daily by flow cytometry, gating for live cells by forward/side scatter criteria. The percentage of GFP+ cells remaining at each day is expressed as a fraction of the initial (day 3 posttransduction) GFP+ percentage. All cell lines except BJAB were used in three independent experiments; a single representative experiment is shown. (b) Absolute growth rates of SUPT-T1 and BW5147 cultures in which >95% of cells had been transduced by the indicated retroviruses. Cell counts were performed daily starting at day 2 postretroviral transduction, and extrapolated cell counts were calculated as described in Materials and Methods. (c) Cell cycle effects of MAML1(13-74)-GFP. DNA content was measured from the SUP-T1 and BW5147 cultures depicted in panel b on day 7 posttransduction (corresponding to day 5 in panel b). Cells were stained with propidium iodide and were analyzed by flow cytometry. MamGFP, MAML1(13-74)-GFP; GFP, GFP only.
Similar articles
- Identification of a family of mastermind-like transcriptional coactivators for mammalian notch receptors.
Wu L, Sun T, Kobayashi K, Gao P, Griffin JD. Wu L, et al. Mol Cell Biol. 2002 Nov;22(21):7688-700. doi: 10.1128/MCB.22.21.7688-7700.2002. Mol Cell Biol. 2002. PMID: 12370315 Free PMC article. - The Nrarp gene encodes an ankyrin-repeat protein that is transcriptionally regulated by the notch signaling pathway.
Krebs LT, Deftos ML, Bevan MJ, Gridley T. Krebs LT, et al. Dev Biol. 2001 Oct 1;238(1):110-9. doi: 10.1006/dbio.2001.0408. Dev Biol. 2001. PMID: 11783997 - Aspartate mutations in presenilin and gamma-secretase inhibitors both impair notch1 proteolysis and nuclear translocation with relative preservation of notch1 signaling.
Berezovska O, Jack C, McLean P, Aster JC, Hicks C, Xia W, Wolfe MS, Kimberly WT, Weinmaster G, Selkoe DJ, Hyman BT. Berezovska O, et al. J Neurochem. 2000 Aug;75(2):583-93. doi: 10.1046/j.1471-4159.2000.0750583.x. J Neurochem. 2000. PMID: 10899933 - New insights into Notch1 regulation of the PI3K-AKT-mTOR1 signaling axis: targeted therapy of γ-secretase inhibitor resistant T-cell acute lymphoblastic leukemia.
Hales EC, Taub JW, Matherly LH. Hales EC, et al. Cell Signal. 2014 Jan;26(1):149-61. doi: 10.1016/j.cellsig.2013.09.021. Epub 2013 Oct 16. Cell Signal. 2014. PMID: 24140475 Review. - Notch, a unifying target in T-cell acute lymphoblastic leukemia?
Screpanti I, Bellavia D, Campese AF, Frati L, Gulino A. Screpanti I, et al. Trends Mol Med. 2003 Jan;9(1):30-5. doi: 10.1016/s1471-4914(02)00003-5. Trends Mol Med. 2003. PMID: 12524208 Review.
Cited by
- Notch signaling in acute promyelocytic leukemia.
Grieselhuber NR, Klco JM, Verdoni AM, Lamprecht T, Sarkaria SM, Wartman LD, Ley TJ. Grieselhuber NR, et al. Leukemia. 2013 Jul;27(7):1548-1557. doi: 10.1038/leu.2013.68. Epub 2013 Mar 4. Leukemia. 2013. PMID: 23455394 Free PMC article. - Loss of periostin/OSF-2 in ErbB2/Neu-driven tumors results in androgen receptor-positive molecular apocrine-like tumors with reduced Notch1 activity.
Sriram R, Lo V, Pryce B, Antonova L, Mears AJ, Daneshmand M, McKay B, Conway SJ, Muller WJ, Sabourin LA. Sriram R, et al. Breast Cancer Res. 2015 Jan 16;17(1):7. doi: 10.1186/s13058-014-0513-8. Breast Cancer Res. 2015. PMID: 25592291 Free PMC article. - Notch subunit heterodimerization and prevention of ligand-independent proteolytic activation depend, respectively, on a novel domain and the LNR repeats.
Sanchez-Irizarry C, Carpenter AC, Weng AP, Pear WS, Aster JC, Blacklow SC. Sanchez-Irizarry C, et al. Mol Cell Biol. 2004 Nov;24(21):9265-73. doi: 10.1128/MCB.24.21.9265-9273.2004. Mol Cell Biol. 2004. PMID: 15485896 Free PMC article. - Small GTPase RhoE/Rnd3 is a critical regulator of Notch1 signaling.
Zhu Z, Todorova K, Lee KK, Wang J, Kwon E, Kehayov I, Kim HG, Kolev V, Dotto GP, Lee SW, Mandinova A. Zhu Z, et al. Cancer Res. 2014 Apr 1;74(7):2082-93. doi: 10.1158/0008-5472.CAN-12-0452. Epub 2014 Feb 13. Cancer Res. 2014. PMID: 24525741 Free PMC article. - In vivo consequences of deleting EGF repeats 8-12 including the ligand binding domain of mouse Notch1.
Ge C, Liu T, Hou X, Stanley P. Ge C, et al. BMC Dev Biol. 2008 Apr 29;8:48. doi: 10.1186/1471-213X-8-48. BMC Dev Biol. 2008. PMID: 18445292 Free PMC article.
References
- Artavanis-Tsakonas, S., M. D. Rand, and R. J. Lake. 1999. Notch signaling: cell fate control and signal integration in development. Science 284:770-776. - PubMed
- Aster, J., W. Pear, R. Hasserjian, H. Erba, F. Davi, B. Luo, M. Scott, D. Baltimore, and J. Sklar. 1994. Functional analysis of the TAN-1 gene, a human homolog of Drosophila notch. Cold Spring Harbor Symp. Quant. Biol. 59:125-136. - PubMed
- Aster, J. C., E. S. Robertson, R. P. Hasserjian, J. R. Turner, E. Kieff, and J. Sklar. 1997. Oncogenic forms of NOTCH1 lacking either the primary binding site for RBP-Jκ or nuclear localization sequences retain the ability to associate with RBP-Jκ and activate transcription. J. Biol. Chem. 272:11336-11343. - PubMed
- Berezovska, O., C. Jack, P. McLean, J. C. Aster, C. Hicks, W. Xia, M. S. Wolfe, W. T. Kimberly, G. Weinmaster, D. J. Selkoe, and B. T. Hyman. 2000. Aspartate mutations in presenilin and gamma-secretase inhibitors both impair notch1 proteolysis and nuclear translocation with relative preservation of notch1 signaling. J. Neurochem. 75:583-593. - PubMed
Publication types
MeSH terms
Substances
LinkOut - more resources
Full Text Sources
Other Literature Sources
Molecular Biology Databases


