Secretory granules are recaptured largely intact after stimulated exocytosis in cultured endocrine cells - PubMed (original) (raw)
Secretory granules are recaptured largely intact after stimulated exocytosis in cultured endocrine cells
Justin W Taraska et al. Proc Natl Acad Sci U S A. 2003.
Abstract
Classical cell biology teaches that exocytosis causes the membrane of exocytic vesicles to disperse into the cell surface and that a cell must later retrieve by molecular sorting whatever membrane components it wishes to keep inside. We have tested whether this view applies to secretory granules in intact PC-12 cells. Three granule proteins were labeled with fluorescent proteins in different colors, and two-color evanescent-field microscopy was used to view single granules during and after exocytosis. Whereas neuro-peptide Y was lost from granules in seconds, tissue plasminogen activator (tPA) and the membrane protein phogrin remained at the granule site for over 1 min, thus providing markers for postexocytic granules. When tPA was imaged simultaneously with cyan fluorescent protein (CFP) as a cytosolic marker, the volume occupied by the granule appeared as a dark spot where it excluded CFP. The spot remained even after tPA reported exocytosis, indicating that granules failed to flatten into the cell surface. Phogrin was labeled with GFP at its luminal end and used to sense the pH in granules. When exocytosis caused the acidic granule interior to neutralize, GFP-phogrin at first brightened and later dimmed again as the interior separated from the extracellular space and reacidified. Reacidification and dimming could be reversed by application of NH(4)Cl. We conclude that most granules reseal in <10 s after releasing cargo, and that these empty or partially empty granules are recaptured otherwise intact.
Figures
Figure 1
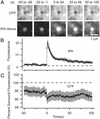
Exocytosis of single NPY–EGFP-labeled granules. (A) Evanescent-field micrograph of the footprint of a live PC-12 cell (dashed line) expressing NPY–EGFP. (B) A single NPY–EGFP-labeled granule undergoing exocytosis (Upper) and the fluorescence at the granule site (Lower). Open circles refer to the images shown. There is a strong fluorescence increase lasting for a single frame; this transient increase defines the moment of fusion and the time origin. Traces as shown in B were aligned to the moment of fusion and normalized to the intensity at the granule site during the last 2 s before fusion. (C) The results then were averaged (43 events, four cells). (D) The number of fusion events in 5-s intervals is plotted against time after raising [K+] (96 events, eight cells).
Figure 2
Other granule proteins disperse more slowly after exocytosis. (A) Colocalization of tPA–Venus and NPY–CFP. Circles were drawn around fluorescent dots in the tPA–Venus image and transferred into the NPY–CFP image. The dotted circle shows an example where no NPY–CFP was detected at the site of a tPA–Venus granule and colocalization was scored negative. (B) tPA–EGFP-labeled granule undergoing exocytosis. Here and in other figures the apparent widening of the fluorescent spot at 0 s artifactually resulted from printing all four panels at the same contrast; the effect is not seen if the panel is displayed such that saturation of gray levels is avoided (not shown). (C) Fluorescence at the granule site. (D) Two-color imaging of a single NPY–EGFP- and phogrin–DsRed-labeled granule undergoing exocytosis. The granule position is outlined by a dashed circle. (E) Average fluorescence trace of granules containing both NPY–EGFP and phogrin–DsRed (17 events, three cells). Fluorescence traces were temporally aligned to the moment of fusion as reported by NPY and then normalized to the last 2 s before fusion and finally averaged as shown in Fig. 1_C_. Throughout, time is relative to the moment of fusion.
Figure 3
Failure of granules to collapse into the plasma membrane. (A) Two-color imaging of single granules from cells cotransfected with CFP and tPA–Venus. Cyan (Upper) and yellow (Lower) images are averages of 18 fusion events in three cells lacking extended dark regions in the CFP channel that may have resulted from failure of cells to adhere uniformly. Movies showing the small regions were aligned to the moment of fusion as reported by tPA–Venus and then averaged. The panels show averages of 25 successive frames each. (B) Fluorescence signals at the sites of tPA–Venus-labeled granules (including those in A) were plotted against time, aligned to the moment of fusion, and averaged (31 events, five cells). (C) CFP fluorescence at granule sites shown in B. No background was subtracted; instead, the CFP fluorescence at the granule site was calculated as a percentage of the intensity in a concentric annulus of 3.5-μm outer diameter. The downward spike at the time of fusion and the apparent increase in the fluorescence deficit were not consistently observed and their origins are not understood.
Figure 4
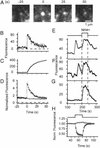
Granules reseal after exocytosis and reacidify. (A) EGFP–phogrin-labeled granules brighten transiently on exocytosis. (B) Plot of the fluorescence intensity at the granule site along with its time integral (C). (D) Average of 14 events in three cells, obtained as described for Fig. 1_C_. Continuous line re-plots data with phogrin–DsRed from Fig. 2_E_. (E_–_G) Brightening of three granules during application of 50 mM NH4Cl. The granules in E and F had previously undergone exocytosis, whereas the granule in G had not. (E_–_G) Plotted as rolling averages of 10 successive measurements to reduce noise. Background was measured as the average of intensities in seven 1.2-μm circles in the image of each cell placed where granules were lacking. (H) Fluorescence changes in cells expressing syntaxin–EGFP on the cell surface. The fluorescence drops markedly when the external medium is acidified (35-μm2 membrane area, average of six cells) but changed only slightly when the NH4Cl-containing solution is applied (six cells). This change may be due to acidic-docked granules that contain small amounts of syntaxin. Because EGFP–phogrin was poorly expressed in our cells, we sought to increase the calcium influx and thus raise the frequency of exocytic events in experiments as desccribed for E and F. This was done by maintaining 50 mM CaCl2 externally both before (62.5 mM NaCl/3 mM KCl/50 mM CaCl2/1 mM MgCl2/10 mM Hepes/10 mM glucose, pH 7.4, 300 milliosmolal) and during (105 mM KCl/50 mM CaCl2/0.7 mM MgCl2/1 mM NaH2PO4/10 mM Hepes, 379 milliosmolal) stimulation. The 50 mM [Ca2+] did not significantly change the fluorescence response during exocytosis in EGFP–phogrin-expressing cells. Fluorescence rose abruptly by a factor 5.5 ± 0.8 and declined with a half-time of 7.9 ± 0.9 s (16 events, five cells).
Comment in
- Kiss-and-run, fuse-pinch-and-linger, fuse-and-collapse: the life and times of a neurosecretory granule.
Ryan TA. Ryan TA. Proc Natl Acad Sci U S A. 2003 Mar 4;100(5):2171-3. doi: 10.1073/pnas.0530260100. Epub 2003 Feb 26. Proc Natl Acad Sci U S A. 2003. PMID: 12606723 Free PMC article. No abstract available.
Similar articles
- Bilayers merge even when exocytosis is transient.
Taraska JW, Almers W. Taraska JW, et al. Proc Natl Acad Sci U S A. 2004 Jun 8;101(23):8780-5. doi: 10.1073/pnas.0401316101. Epub 2004 Jun 1. Proc Natl Acad Sci U S A. 2004. PMID: 15173592 Free PMC article. - Syntaxin clusters assemble reversibly at sites of secretory granules in live cells.
Barg S, Knowles MK, Chen X, Midorikawa M, Almers W. Barg S, et al. Proc Natl Acad Sci U S A. 2010 Nov 30;107(48):20804-9. doi: 10.1073/pnas.1014823107. Epub 2010 Nov 12. Proc Natl Acad Sci U S A. 2010. PMID: 21076041 Free PMC article. - Imaging exocytosis of single insulin secretory granules with evanescent wave microscopy: distinct behavior of granule motion in biphasic insulin release.
Ohara-Imaizumi M, Nakamichi Y, Tanaka T, Ishida H, Nagamatsu S. Ohara-Imaizumi M, et al. J Biol Chem. 2002 Feb 8;277(6):3805-8. doi: 10.1074/jbc.C100712200. Epub 2001 Dec 21. J Biol Chem. 2002. PMID: 11751926 - Mechanisms of secretory granule transport and exocytosis in anterior pituitary cells.
Senda T. Senda T. Ital J Anat Embryol. 1995;100 Suppl 1:219-29. Ital J Anat Embryol. 1995. PMID: 11322296 Review. - Biosynthesis and secretion of pituitary hormones: dynamics and regulation.
Moore HP, Andresen JM, Eaton BA, Grabe M, Haugwitz M, Wu MM, Machen TE. Moore HP, et al. Arch Physiol Biochem. 2002 Apr;110(1-2):16-25. doi: 10.1076/apab.110.1.16.903. Arch Physiol Biochem. 2002. PMID: 11935396 Review.
Cited by
- Porosomes in uterine epithelial cells: Ultrastructural identification and characterization during early pregnancy.
Kalam SN, Dowland S, Lindsay L, Murphy CR. Kalam SN, et al. J Morphol. 2022 Nov;283(11):1381-1389. doi: 10.1002/jmor.21504. Epub 2022 Oct 7. J Morphol. 2022. PMID: 36059156 Free PMC article. - The neuronal porosome complex in health and disease.
Naik AR, Lewis KT, Jena BP. Naik AR, et al. Exp Biol Med (Maywood). 2016 Jan;241(2):115-30. doi: 10.1177/1535370215598400. Epub 2015 Aug 11. Exp Biol Med (Maywood). 2016. PMID: 26264442 Free PMC article. Review. - Sequential compound exocytosis of large dense-core vesicles in PC12 cells studied with TEPIQ (two-photon extracellular polar-tracer imaging-based quantification) analysis.
Kishimoto T, Liu TT, Hatakeyama H, Nemoto T, Takahashi N, Kasai H. Kishimoto T, et al. J Physiol. 2005 Nov 1;568(Pt 3):905-15. doi: 10.1113/jphysiol.2005.094003. Epub 2005 Sep 8. J Physiol. 2005. PMID: 16150797 Free PMC article. - A fast mode of membrane fusion dependent on tight SNARE zippering.
Bretou M, Anne C, Darchen F. Bretou M, et al. J Neurosci. 2008 Aug 20;28(34):8470-6. doi: 10.1523/JNEUROSCI.0860-08.2008. J Neurosci. 2008. PMID: 18716205 Free PMC article. - A new role for myosin II in vesicle fission.
Flores JA, Balseiro-Gomez S, Cabeza JM, Acosta J, Ramirez-Ponce P, Ales E. Flores JA, et al. PLoS One. 2014 Jun 24;9(6):e100757. doi: 10.1371/journal.pone.0100757. eCollection 2014. PLoS One. 2014. PMID: 24959909 Free PMC article.
References
- Henkel A W, Almers W. Curr Opin Neurobiol. 1996;6:350–357. - PubMed
- Palfrey H C, Artalejo C R. Neuroscience. 1998;83:969–989. - PubMed
- Valtorta F, Meldolesi J, Fesce R. Trends Cell Biol. 2001;11:324–328. - PubMed
- Fernandez J M, Neher E, Gomperts B D. Nature. 1984;312:453–455. - PubMed
- Spruce A E, Breckenridge L J, Lee A K, Almers W. Neuron. 1990;4:643–654. - PubMed
Publication types
MeSH terms
Substances
LinkOut - more resources
Full Text Sources
Other Literature Sources
Research Materials
Miscellaneous


