MAPPFinder: using Gene Ontology and GenMAPP to create a global gene-expression profile from microarray data - PubMed (original) (raw)
MAPPFinder: using Gene Ontology and GenMAPP to create a global gene-expression profile from microarray data
Scott W Doniger et al. Genome Biol. 2003.
Abstract
MAPPFinder is a tool that creates a global gene-expression profile across all areas of biology by integrating the annotations of the Gene Ontology (GO) Project with the free software package GenMAPP http://www.GenMAPP.org. The results are displayed in a searchable browser, allowing the user to rapidly identify GO terms with over-represented numbers of gene-expression changes. Clicking on GO terms generates GenMAPP graphical files where gene relationships can be explored, annotated, and files can be freely exchanged.
Figures
Figure 1
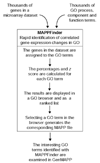
How MAPPFinder works. Microarray data is imported into MAPPFinder as a GenMAPP gene-expression dataset. Using a relational database and the gene-association files from GO, MAPPFinder assigns the thousands of genes in the dataset to the thousands of GO terms. Using a user-defined criterion for a significant gene-expression change, MAPPFinder calculates the percentage of genes meeting the criterion and a statistical score for each GO term. Using the ranked list and GO browser generated by MAPPFinder the user can quickly identify interesting GO terms with high levels of gene-expression changes. The specific genes involved in these GO terms can be examined on automatically generated MAPPs using GenMAPP.
Figure 2
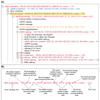
The MAPPFinder browser. (a) The branch of the GO hierarchy rooted at the biological process term 'RNA processing' is shown. The terms are colored with the MAPPFinder results for genes significantly increased in the 12.5-day embryo versus the adult mice. Terms with 0-5% of genes changed are colored black, 5-15% purple, 15-25% dark blue, 25-35% light blue, 35-45% green, 45-55% orange, and greater than 55% red. The term RNA processing is highlighted in yellow, indicating that it meets the search or filter requirements. (b) The MAPPFinder results. The term RNA processing is shown with the various MAPPFinder results labeled. The percentage of genes meeting the criterion and the percentage of genes in GO measured in this experiment are calculated. The results are calculated for both this node individually and in combination with all of its child nodes (that is, nested results). The z score indicates whether the number of genes meeting the criterion is higher or lower than expected. A positive score indicates that more genes are changed than expected; a negative score means fewer genes are changed than expected, and a score near 0 indicates that the number of changes approximates to the expected value for that GO term.
Figure 3
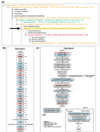
Linking MAPPFinder to GenMAPP. (a) The MAPPFinder browser displaying the 12.5-day embryo increased results for the GO process term 'glycolysis'. Color-coding of GO terms is the same as in Figure 2. (b) Clicking on the GO term glycolysis in the MAPPFinder browser builds the corresponding GenMAPP MAPP file. This MAPP file contains a list of genes associated with this term and all of its children. (c) Genes in the GO list were rearranged with the tools in GenMAPP to depict the glycolysis pathway with the metabolic intermediates and cellular compartments. Color-coding of genes for (b) and (c) is as follows: Red, fold change >1.2 and p < 0.05 in the 12.5-day embryo versus adult mice. Blue, fold change < -1.2 and p < 0.05. Gray, neither of the above criteria met. White, gene not found on the array.
Similar articles
- Using GenMAPP and MAPPFinder to view microarray data on biological pathways and identify global trends in the data.
Dahlquist KD. Dahlquist KD. Curr Protoc Bioinformatics. 2004 May;Chapter 7:Unit 7.5. doi: 10.1002/0471250953.bi0705s05. Curr Protoc Bioinformatics. 2004. PMID: 18428731 - GoSurfer: a graphical interactive tool for comparative analysis of large gene sets in Gene Ontology space.
Zhong S, Storch KF, Lipan O, Kao MC, Weitz CJ, Wong WH. Zhong S, et al. Appl Bioinformatics. 2004;3(4):261-4. doi: 10.2165/00822942-200403040-00009. Appl Bioinformatics. 2004. PMID: 15702958 - AffyMiner: mining differentially expressed genes and biological knowledge in GeneChip microarray data.
Lu G, Nguyen TV, Xia Y, Fromm M. Lu G, et al. BMC Bioinformatics. 2006 Dec 12;7 Suppl 4(Suppl 4):S26. doi: 10.1186/1471-2105-7-S4-S26. BMC Bioinformatics. 2006. PMID: 17217519 Free PMC article. - GenMAPP 2: new features and resources for pathway analysis.
Salomonis N, Hanspers K, Zambon AC, Vranizan K, Lawlor SC, Dahlquist KD, Doniger SW, Stuart J, Conklin BR, Pico AR. Salomonis N, et al. BMC Bioinformatics. 2007 Jun 24;8:217. doi: 10.1186/1471-2105-8-217. BMC Bioinformatics. 2007. PMID: 17588266 Free PMC article. - Open source software for the analysis of microarray data.
Dudoit S, Gentleman RC, Quackenbush J. Dudoit S, et al. Biotechniques. 2003 Mar;Suppl:45-51. Biotechniques. 2003. PMID: 12664684 Review.
Cited by
- Decreased defense gene expression in tolerance versus resistance to Verticillium dahliae in potato.
Tai HH, Goyer C, Bud Platt HW, De Koeyer D, Murphy A, Uribe P, Halterman D. Tai HH, et al. Funct Integr Genomics. 2013 Aug;13(3):367-78. doi: 10.1007/s10142-013-0329-0. Epub 2013 Jul 11. Funct Integr Genomics. 2013. PMID: 23842988 - Potential biological functions of cytochrome P450 reductase-dependent enzymes in small intestine: novel link to expression of major histocompatibility complex class II genes.
D'Agostino J, Ding X, Zhang P, Jia K, Fang C, Zhu Y, Spink DC, Zhang QY. D'Agostino J, et al. J Biol Chem. 2012 May 18;287(21):17777-17788. doi: 10.1074/jbc.M112.354274. Epub 2012 Mar 27. J Biol Chem. 2012. PMID: 22453923 Free PMC article. - State of the art in silico tools for the study of signaling pathways in cancer.
Villaamil VM, Gallego GA, Cainzos IS, Valladares-Ayerbes M, Aparicio LMA. Villaamil VM, et al. Int J Mol Sci. 2012;13(6):6561-6581. doi: 10.3390/ijms13066561. Epub 2012 May 29. Int J Mol Sci. 2012. PMID: 22837650 Free PMC article. Review. - Selective degradation of transcripts during meiotic maturation of mouse oocytes.
Su YQ, Sugiura K, Woo Y, Wigglesworth K, Kamdar S, Affourtit J, Eppig JJ. Su YQ, et al. Dev Biol. 2007 Feb 1;302(1):104-17. doi: 10.1016/j.ydbio.2006.09.008. Epub 2006 Sep 12. Dev Biol. 2007. PMID: 17022963 Free PMC article. - Benzo[a]pyrene diol epoxide stimulates an inflammatory response in normal human lung fibroblasts through a p53 and JNK mediated pathway.
Dreij K, Rhrissorrakrai K, Gunsalus KC, Geacintov NE, Scicchitano DA. Dreij K, et al. Carcinogenesis. 2010 Jun;31(6):1149-57. doi: 10.1093/carcin/bgq073. Epub 2010 Apr 9. Carcinogenesis. 2010. PMID: 20382639 Free PMC article.
References
- Nakao M, Bono H, Kawashima S, Kamiya T, Sato K, Goto S, Kanehisa M. Genome-scale gene expression analysis and pathway reconstruction in KEGG. Genome Inform Ser WorkShop Genome Inform. 1999;10:94–103. - PubMed
Publication types
MeSH terms
LinkOut - more resources
Full Text Sources
Other Literature Sources


