A critical role for PPARalpha-mediated lipotoxicity in the pathogenesis of diabetic cardiomyopathy: modulation by dietary fat content - PubMed (original) (raw)
A critical role for PPARalpha-mediated lipotoxicity in the pathogenesis of diabetic cardiomyopathy: modulation by dietary fat content
Brian N Finck et al. Proc Natl Acad Sci U S A. 2003.
Abstract
To explore the role of peroxisome proliferator-activated receptor alpha (PPARalpha)-mediated derangements in myocardial metabolism in the pathogenesis of diabetic cardiomyopathy, insulinopenic mice with PPARalpha deficiency (PPARalpha(-/-)) or cardiac-restricted overexpression [myosin heavy chain (MHC)-PPAR] were characterized. Whereas PPARalpha(-/-) mice were protected from the development of diabetes-induced cardiac hypertrophy, the combination of diabetes and the MHC-PPAR genotype resulted in a more severe cardiomyopathic phenotype than either did alone. Cardiomyopathy in diabetic MHC-PPAR mice was accompanied by myocardial long-chain triglyceride accumulation. The cardiomyopathic phenotype was exacerbated in MHC-PPAR mice fed a diet enriched in triglyceride containing long-chain fatty acid, an effect that was reversed by discontinuing the high-fat diet and absent in mice given a medium-chain triglyceride-enriched diet. Reactive oxygen intermediates were identified as candidate mediators of cardiomyopathic effects in MHC-PPAR mice. These results link dysregulation of the PPARalpha gene regulatory pathway to cardiac dysfunction in the diabetic and provide a rationale for serum lipid-lowering strategies in the treatment of diabetic cardiomyopathy.
Figures
Figure 1
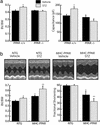
The diabetic cardiac phenotype is influenced by the activity of PPARα. (a) PPARα-null mice are resistant to development of diabetic ventricular hypertrophy. (Left) Bars represent mean (± SEM) BV/BW ratios (n ≥ 11) of PPARα+/+ and PPARα−/− mice 6 weeks after an injection of vehicle or STZ. (Right) Bars represent mean cellular capacitance (n ≥ 12) of isolated cardiomyocytes from PPARα+/+ and PPARα−/− mice 6 weeks after injection of vehicle or STZ. *, P < 0.05 vs. vehicle-injected PPARα+/+ and all PPARα−/− mice. (b) Ventricular hypertrophy and dysfunction are exacerbated in diabetic MHC-PPAR mice (Lower Left). Bars represent mean (± SEM) BV/BW ratios (n ≥ 7) of MHC-PPAR and NTG littermate mice after an injection of saline vehicle or STZ. (Lower Right) Bars represent mean percent LV fractional shortening (n ≥ 7 for each group) as assessed by echocardiographic analysis 6 weeks after an injection of vehicle or STZ. *, P < 0.05 vs. vehicle-injected NTG mice. **, P < 0.05 vs. NTG mice and vehicle-injected MHC-PPAR mice. (Upper) Representative two-dimensional guided M-mode images of the LV obtained from the parasternal view at the mid-ventricular level of control and diabetic NTG and MHC-PPAR mice.
Figure 2
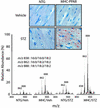
Myocardial TAG accumulation in diabetic MHC-PPAR mice. (Upper) Photomicrographs depicting the histologic appearance of ventricular tissue from NTG and MHC-PPAR mice (404-3 line) after an injection of vehicle or STZ are shown. Red droplets indicate neutral lipid staining. (Lower) Representative spectra from ESIMS analyses for linoleic acid-containing TAGs. m/z ratios of 838, 862, and 888 denote TAGs containing acyl groups with chain lengths of 16:0/16:0/18:2, 16:0/18:2/18:2, and 18:1/18:2/18:2, respectively.
Figure 3
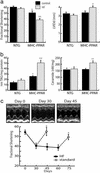
The cardiomyopathy of MHC-PPAR mice is worsened by consumption of a diet rich in LCFA. (a) Bars represent mean LV FS (Left) and LV internal diameter at diastole (LVIDd, Right) of NTG and MHC-PPAR (404-4 line) mice on HF chow rich in LCFA or calorie-matched control chow. (b) TAG and ceramide levels in hearts of NTG and MHC-PPAR mice after HF diet treatment, as determined by ESIMS. Bars represent mean levels of long-chain TAG (Left) and ceramide (Right). *, P < 0.05 vs. NTG mice. **, P < 0.05 vs. NTG mice and control chow-fed MHC-PPAR mice. (c) HF diet-induced ventricular dysfunction in MHC-PPAR mice is reversible. The graph displays mean FS of MHC-PPAR mice plotted as a function of time. Black squares represent transgenic mice fed the HF diet. Subgroups of mice returned to a standard rodent chow for 15 days at the 30th and 60th days of the trial are denoted by the white circles. *, P < 0.05 vs. corresponding HF-fed MHC-PPAR mice. (Upper) M-mode echocardiographic images of the LV of a representative MHC-PPAR mouse at baseline (Day 0), after 30 days on the HF diet (Day 30) and 15 days after being returned to the standard chow (Day 45).
Figure 4
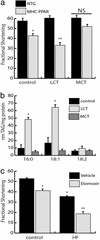
Diet-induced cardiac lipotoxicity depends upon fatty acid chain length but does not require increased flux of fatty acids through mitochondrial pathways. (a) MCT diet rescues cardiac dysfunction in MHC-PPAR mice. Bars represent mean echocardiographic-determined LV fractional shortening of NTG and MHC-PPAR mice (404-3 line; n ≥ 5 for each group) 8 weeks after initiation of control, LCT, or MCT diet administration. *, P < 0.05 vs. NTG mice. **, P < 0.05 vs. NTG mice and MHC-PPAR mice on control or MCT chows. NS = nonsignificant. (b) LCT but not MCT HF diet increases myocardial TAG levels. Bars represent mean levels of TAG-associated fatty acids with chain length of 16:0, 18:1, and 18:2 in MHC-PPAR mouse ventricles after 8 weeks of control, LCT, or MCT diet administration. *, P < 0.05 vs. MHC-PPAR mice fed control or MCT chow. (c) Inhibition of mitochondrial fatty acid import exacerbates cardiac dysfunction in MHC-PPAR mice. Fractional shortening of MHC-PPAR mice (404-4 line; n ≥ 5 for each group) after 3 weeks of daily injections of etomoxir sodium (25 ng/kg/day) while receiving control or HF chow. *, P < 0.05 vs. MHC-PPAR mice on control chow. **, P < 0.05 vs. MHC-PPAR mice on control chow and saline-treated HF mice.
Figure 5
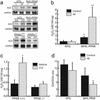
Activation of extra-mitochondrial lipid metabolic pathways correlates with the severity of the cardiomyopathic phenotype. (a) HF diet or STZ treatment activates the peroxisomal FAO pathway in a PPARα-dependent manner. Representative autoradiographs of Northern blot analyses performed with total RNA isolated from cardiac ventricle of NTG or MHC-PPAR mice after 4 weeks of HF or control (C) diet (Top), NTG or MHC-PPAR mice 6 weeks after STZ administration (Middle), PPARα+/+ and PPARα−/− mice 5 days after vehicle or STZ injection (Bottom) using cDNA probes denoted at left. (b) Bars represent mean hydrogen peroxide (H2O2) levels in cardiac extracts from NTG or MHC-PPAR mice after 4 weeks of HF diet. *, P < 0.05 vs. NTG mice. **, P < 0.05 vs. NTG mice and MHC-PPAR mice fed control chow. (c) PPARα is required for the generation of H2O2 in the diabetic heart. Bars represent mean H2O2 levels in cardiac extracts isolated from PPARα+/+ and PPARα−/− mice 5 days after an injection of vehicle or STZ. *, P < 0.05 vs. vehicle-injected wild-type and all PPARα-null mice. (d) Bars represent mean GSH/GSSG ratios (n ≥ 4) in cardiac extracts from MHC-PPAR mice after 4 weeks of control or HF diet. *, P < 0.05 vs. NTG mice given HF chow.
Similar articles
- Rescue of cardiomyopathy in peroxisome proliferator-activated receptor-alpha transgenic mice by deletion of lipoprotein lipase identifies sources of cardiac lipids and peroxisome proliferator-activated receptor-alpha activators.
Duncan JG, Bharadwaj KG, Fong JL, Mitra R, Sambandam N, Courtois MR, Lavine KJ, Goldberg IJ, Kelly DP. Duncan JG, et al. Circulation. 2010 Jan 26;121(3):426-35. doi: 10.1161/CIRCULATIONAHA.109.888735. Epub 2010 Jan 11. Circulation. 2010. PMID: 20065164 Free PMC article. - The cardiac phenotype induced by PPARalpha overexpression mimics that caused by diabetes mellitus.
Finck BN, Lehman JJ, Leone TC, Welch MJ, Bennett MJ, Kovacs A, Han X, Gross RW, Kozak R, Lopaschuk GD, Kelly DP. Finck BN, et al. J Clin Invest. 2002 Jan;109(1):121-30. doi: 10.1172/JCI14080. J Clin Invest. 2002. PMID: 11781357 Free PMC article. - CD36 deficiency rescues lipotoxic cardiomyopathy.
Yang J, Sambandam N, Han X, Gross RW, Courtois M, Kovacs A, Febbraio M, Finck BN, Kelly DP. Yang J, et al. Circ Res. 2007 Apr 27;100(8):1208-17. doi: 10.1161/01.RES.0000264104.25265.b6. Epub 2007 Mar 15. Circ Res. 2007. PMID: 17363697 - The role of the peroxisome proliferator-activated receptor alpha pathway in pathological remodeling of the diabetic heart.
Finck BN. Finck BN. Curr Opin Clin Nutr Metab Care. 2004 Jul;7(4):391-6. doi: 10.1097/01.mco.0000134371.70815.32. Curr Opin Clin Nutr Metab Care. 2004. PMID: 15192440 Review. - PPAR signaling in the control of cardiac energy metabolism.
Barger PM, Kelly DP. Barger PM, et al. Trends Cardiovasc Med. 2000 Aug;10(6):238-45. doi: 10.1016/s1050-1738(00)00077-3. Trends Cardiovasc Med. 2000. PMID: 11282301 Review.
Cited by
- Role of lipins in cardiovascular diseases.
Ding Z, Song H, Wang F. Ding Z, et al. Lipids Health Dis. 2023 Nov 14;22(1):196. doi: 10.1186/s12944-023-01961-6. Lipids Health Dis. 2023. PMID: 37964368 Free PMC article. Review. - Molecular determinants of the cardiometabolic phenotype.
de las Fuentes L, de Simone G, Arnett DK, Dávila-Román VG. de las Fuentes L, et al. Endocr Metab Immune Disord Drug Targets. 2010 Jun;10(2):109-23. doi: 10.2174/187153010791213119. Endocr Metab Immune Disord Drug Targets. 2010. PMID: 20384572 Free PMC article. Review. - Imaging of myocardial metabolism.
Herrero P, Gropler RJ. Herrero P, et al. J Nucl Cardiol. 2005 May-Jun;12(3):345-58. doi: 10.1016/j.nuclcard.2005.03.010. J Nucl Cardiol. 2005. PMID: 15944540 Review. - Rescue of cardiomyopathy in peroxisome proliferator-activated receptor-alpha transgenic mice by deletion of lipoprotein lipase identifies sources of cardiac lipids and peroxisome proliferator-activated receptor-alpha activators.
Duncan JG, Bharadwaj KG, Fong JL, Mitra R, Sambandam N, Courtois MR, Lavine KJ, Goldberg IJ, Kelly DP. Duncan JG, et al. Circulation. 2010 Jan 26;121(3):426-35. doi: 10.1161/CIRCULATIONAHA.109.888735. Epub 2010 Jan 11. Circulation. 2010. PMID: 20065164 Free PMC article. - Early impairment of transmural principal strains in the left ventricular wall after short-term, high-fat feeding of mice predisposed to cardiac steatosis.
Hankiewicz JH, Banke NH, Farjah M, Lewandowski ED. Hankiewicz JH, et al. Circ Cardiovasc Imaging. 2010 Nov;3(6):710-7. doi: 10.1161/CIRCIMAGING.110.959098. Epub 2010 Sep 13. Circ Cardiovasc Imaging. 2010. PMID: 20837747 Free PMC article.
References
- Rubler S, Dlugash J, Yuceoglu Y Z, Kumral T, Branwood A W, Grishman A. Am J Cardiol. 1972;30:595–602. - PubMed
- Stone P H, Muller J E, Hartwell T, York B J, Rutherford J D, Parker C B, Turi Z G, Strauss H W, Willerson J T, Robertson T. J Am Coll Cardiol. 1989;14:49–57. - PubMed
- Neely J R, Rovetto M J, Oram J F. Prog Cardiovasc Dis. 1972;15:289–329. - PubMed
- Lopaschuk G D, Spafford M. Circ Res. 1989;65:378–387. - PubMed
- Belke D D, Larsen T S, Gibbs E M, Severson D L. Am J Physiol. 2000;279:E1104–E1113. - PubMed
Publication types
MeSH terms
Substances
Grants and funding
- P01 HL57278/HL/NHLBI NIH HHS/United States
- P01 HL13851/HL/NHLBI NIH HHS/United States
- P30 DK056341/DK/NIDDK NIH HHS/United States
- P30 DK56341/DK/NIDDK NIH HHS/United States
- R01 DK045416/DK/NIDDK NIH HHS/United States
- P01 HL013851/HL/NHLBI NIH HHS/United States
- F32 HL067575/HL/NHLBI NIH HHS/United States
- P30 DK52574/DK/NIDDK NIH HHS/United States
- P01 HL057278/HL/NHLBI NIH HHS/United States
- P30 DK052574/DK/NIDDK NIH HHS/United States
- R01 DK45416/DK/NIDDK NIH HHS/United States
LinkOut - more resources
Full Text Sources
Other Literature Sources
Medical
Molecular Biology Databases
Research Materials
