Placental mammal diversification and the Cretaceous-Tertiary boundary - PubMed (original) (raw)
Placental mammal diversification and the Cretaceous-Tertiary boundary
Mark S Springer et al. Proc Natl Acad Sci U S A. 2003.
Abstract
Competing hypotheses for the timing of the placental mammal radiation focus on whether extant placental orders originated and diversified before or after the Cretaceous-Tertiary (KT) boundary. Molecular studies that have addressed this issue suffer from single calibration points, unwarranted assumptions about the molecular clock, andor taxon sampling that lacks representatives of all placental orders. We investigated this problem using the largest available molecular data set for placental mammals, which includes segments of 19 nuclear and three mitochondrial genes for representatives of all extant placental orders. We used the ThorneKishino method, which permits simultaneous constraints from the fossil record and allows rates of molecular evolution to vary on different branches of a phylogenetic tree. Analyses that used different sets of fossil constraints, different priors for the base of Placentalia, and different data partitions all support interordinal divergences in the Cretaceous followed by intraordinal diversification mostly after the KT boundary. Four placental orders show intraordinal diversification that predates the KT boundary, but only by an average of 10 million years. In contrast to some molecular studies that date the rat-mouse split as old as 46 million years, our results show improved agreement with the fossil record and place this split at 16-23 million years. To test the hypothesis that molecular estimates of Cretaceous divergence times are an artifact of increased body size subsequent to the KT boundary, we also performed analyses with a "KT body size" taxon set. In these analyses, interordinal splits remained in the Cretaceous.
Figures
Figure 1
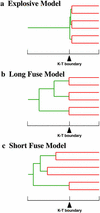
Simplified versions of three models (1) for the timing and diversification of placental mammals. Red branches indicate intraordinal diversification; green branches indicate interordinal divergences. A simplified time scale is shown below each tree, with an arrow marking the K/T boundary.
Figure 2
Molecular time scale for the orders of placental mammals based on the 16,397-bp data set and maximum likelihood tree of ref. with an opossum outgroup (data not shown), 13 fossil constraints (Materials and Methods), and a mean prior of 105 mya for the placental root. Ordinal designations are listed above the branches. Orange and green lines denote orders with basal diversification before or after the K/T boundary, respectively. Black lines depict orders for which only one taxon was available. Asterisks denote placental taxa included in the “K/T body size” taxon set. The composition of chimeric taxa, including caniform, caviomorph, strepsirrhine, and sirenian, is indicated elsewhere (14). Numbers for internal nodes are cross-referenced in the supporting information.
Similar articles
- Waking the undead: Implications of a soft explosive model for the timing of placental mammal diversification.
Springer MS, Emerling CA, Meredith RW, Janečka JE, Eizirik E, Murphy WJ. Springer MS, et al. Mol Phylogenet Evol. 2017 Jan;106:86-102. doi: 10.1016/j.ympev.2016.09.017. Epub 2016 Sep 19. Mol Phylogenet Evol. 2017. PMID: 27659724 - Strong mitochondrial DNA support for a Cretaceous origin of modern avian lineages.
Brown JW, Rest JS, García-Moreno J, Sorenson MD, Mindell DP. Brown JW, et al. BMC Biol. 2008 Jan 28;6:6. doi: 10.1186/1741-7007-6-6. BMC Biol. 2008. PMID: 18226223 Free PMC article. - The soft explosive model of placental mammal evolution.
Phillips MJ, Fruciano C. Phillips MJ, et al. BMC Evol Biol. 2018 Jul 3;18(1):104. doi: 10.1186/s12862-018-1218-x. BMC Evol Biol. 2018. PMID: 29969980 Free PMC article. - Molecular evidence for the early divergence of placental mammals.
Easteal S. Easteal S. Bioessays. 1999 Dec;21(12):1052-8; discussion 1059. doi: 10.1002/(SICI)1521-1878(199912)22:1<1052::AID-BIES9>3.0.CO;2-6. Bioessays. 1999. PMID: 10580990 Review. - [Molecular dating in the genomic era].
Douzery EJ, Delsuc F, Philippe H. Douzery EJ, et al. Med Sci (Paris). 2006 Apr;22(4):374-80. doi: 10.1051/medsci/2006224374. Med Sci (Paris). 2006. PMID: 16597406 Review. French.
Cited by
- Unique Transcriptomic Cell Types of the Granular Retrosplenial Cortex are Preserved Across Mice and Rats Despite Dramatic Changes in Key Marker Genes.
Brooks IAW, Jedrasiak-Cape I, Rybicki-Kler C, Ekins TG, Ahmed OJ. Brooks IAW, et al. bioRxiv [Preprint]. 2024 Sep 17:2024.09.17.613545. doi: 10.1101/2024.09.17.613545. bioRxiv. 2024. PMID: 39345493 Free PMC article. Preprint. - Modeling Substitution Rate Evolution across Lineages and Relaxing the Molecular Clock.
Mello B, Schrago CG. Mello B, et al. Genome Biol Evol. 2024 Sep 3;16(9):evae199. doi: 10.1093/gbe/evae199. Genome Biol Evol. 2024. PMID: 39332907 Free PMC article. Review. - Transcription of Endogenous Retroviruses: Broad and Precise Mechanisms of Control.
Jarosz AS, Halo JV. Jarosz AS, et al. Viruses. 2024 Aug 17;16(8):1312. doi: 10.3390/v16081312. Viruses. 2024. PMID: 39205286 Free PMC article. Review. - Five years later, with double the demographic data, naked mole-rat mortality rates continue to defy Gompertzian laws by not increasing with age.
Ruby JG, Smith M, Buffenstein R. Ruby JG, et al. Geroscience. 2024 Oct;46(5):5321-5341. doi: 10.1007/s11357-024-01201-4. Epub 2024 May 21. Geroscience. 2024. PMID: 38773057 Free PMC article. - Speciation patterns of Aedes mosquitoes in the Scutellaris Group: a mitochondrial perspective.
Rakotonirina A, Dauga C, Pol M, Hide M, Vuth L, Ballan V, Kilama S, Russet S, Marcombe S, Boyer S, Pocquet N. Rakotonirina A, et al. Sci Rep. 2024 May 13;14(1):10930. doi: 10.1038/s41598-024-61573-7. Sci Rep. 2024. PMID: 38740928 Free PMC article.
References
- Archibald J D, Deutschman D H. J Mammal Evol. 2001;8:107–124.
- Gingerich P D. In: Patterns of Evolution as Illustrated by the Fossil Record. Hallam A, editor. Amsterdam: Elsevier; 1977. pp. 469–500.
- Carroll R L. Patterns and Processes of Vertebrate Evolution. Cambridge, U.K.: Cambridge Univ. Press; 1997.
- Foote M, Hunter J P, Janis C M, Sepkoski J J., Jr Science. 1999;283:1310–1314. - PubMed
- Benton M J. BioEssays. 1999;21:1045–1051. - PubMed
MeSH terms
Substances
LinkOut - more resources
Full Text Sources

