GATA-1 as a regulator of mast cell differentiation revealed by the phenotype of the GATA-1low mouse mutant - PubMed (original) (raw)
GATA-1 as a regulator of mast cell differentiation revealed by the phenotype of the GATA-1low mouse mutant
Anna Rita Migliaccio et al. J Exp Med. 2003.
Abstract
Here it is shown that the phenotype of adult mice lacking the first enhancer (DNA hypersensitive site I) and the distal promoter of the GATA-1 gene (neo Delta HS or GATA-1(low) mutants) reveals defects in mast cell development. These include the presence of morphologically abnormal alcian blue(+) mast cells and apoptotic metachromatic(-) mast cell precursors in connective tissues and peritoneal lavage and numerous (60-70% of all the progenitors) "unique" trilineage cells committed to erythroid, megakaryocytic, and mast pathways in the bone marrow and spleen. These abnormalities, which were mirrored by impaired mast differentiation in vitro, were reversed by retroviral-mediated expression of GATA-1 cDNA. These data indicate an essential role for GATA-1 in mast cell differentiation.
Figures
Figure 1.
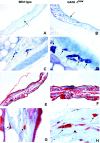
Connective tissue of the ear of the GATA-1low mice contains high numbers of mast cell precursors (metachromatic− after toluidine blue) but normal numbers of more mature (alcian blue+ safranin+) mast cells. Toluidine blue (A–D) and alcian blue/safranin (E–H) staining of consecutive paraffin-embedded sections of the ear from one representative GATA-1low mouse (right panels) and a wild-type (left panels) littermate, as indicated. The presence of mast cells and their precursors is indicated by arrows. The results are representative of replicative analysis from at least four mutants and four normal mice. ×10 in A, B, E, and F and ×100 in C, D, G, and H.
Figure 2.
Connective mast cells from the GATA-1low mice exhibit abnormal morphology and express lower levels of GATA-1 than the cells of normals. Acidified toluidine blue staining (A and B) and GATA-1–specific immunohistochemistry (C and D) of consecutive paraffin-embedded sections from the skin at the base of the ear from a GATA-1low mouse and its normal littermate (right and left panels) and transmission electron microscopy (E and F) of the same specimens. Negative controls for the GATA-1 staining were represented by slides incubated with an irrelevant isotype-matched antibody (not depicted). The presence of mast cells and their precursors is indicated by arrows. Similar results were obtained in at least four independent analysis. ×10 in A and B, ×100 in C and D and the inserts, and ×4,400 in E and F.
Figure 3.
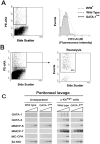
Mast cells in peritoneal lavage from GATA-1low mice express lower levels of FcɛRI and of the proteases MMCP-6 and MC-CPA than the corresponding cells from normal littermates. (A) The FACS® analysis of cells from peritoneal lavage from normal and GATA-1low mice stained with PE c-kit and FITC-FcɛRI is presented. Cells from the peritoneal lavage of the mast cells deficient W/Wv mice (reference 51) were analyzed in parallel as negative control. The gating used for the FcɛRI analysis is shown in a representative dot plot of PE c-kit versus side scatter analysis. Very similar c-kit/side scatter dot plots were observed in all the cases. The isotype control for the FcɛRI analysis is not shown because it is superimposable to the histogram obtained with cells from the W/Wv mouse. (B) The gating used to purify c-kithigh cells from the peritoneal lavage and a representative reanalysis after sorting of the purified cells is presented. In all of the cases, >80% of the sorted cells were c-kithigh upon reanalysis. The semiquantitative RT-PCR analysis for the expression of β2 microglobulin (β2-MG), GATA-1, GATA-2, MMCP-6, MMCP-7, and MC-CPA in unseparated or c-kithigh cells of peritoneal lavage from GATA-1low and normal littermates is presented in C. Each product was amplified for increasing number of cycles (20, 25, 30, and 35), as indicated by the triangle on the top of the panels. Similar results were obtained in two additional experiments.
Figure 4.
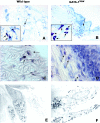
Connective region of the ear from the GATA-1low mice contains high numbers of apoptotic cells. TUNEL staining of representative paraffin-embedded sections of the ear from wild-type (A and C) and GATA-1low (B and D) mice, as indicated. Negative controls were represented by tissue sections treated with a fluorescent deoxyuridine triphosphate-free TUNEL reaction mixture and are not presented for convenience. Fluorescent nuclei were not detected in negative controls (not depicted), were rare (<5/mm2) in sections from the wild-type ear (A and C), and were numerous (134 ± 2/mm2) in the connective region just below the epithelium of the sections from the GATA-1low ear (B and D). ×10 and ×40 in the top and bottom panels, respectively.
Figure 5.
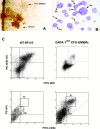
Bone marrow of GATA-1low mice contains trilineage progenitor cells that give rise to colonies composed of erythroblasts, megakaryocytes, and mast cells. (A) The morphology of a trilineage colony, as compared with that of a BFU-E–derived colony growing in its neighborhood is presented. The colony was photographed at day 7 in bone marrow cultures of GATA-1low mice stimulated with SCF, IL-3, EPO, and TPO. (B) May-Grunwald/Giemsa staining of the smear of a representative trilineage colony is presented. Erythroid (E), megakaryocytic (Mk), and mast (Mc) cells are indicated by arrows. Similar results were observed on smears of at least 10 additional individual colonies. ×10 and ×100 in the left and right panels, respectively. (C) FACS® analysis of cells pooled from CFU-EMkMc–derived colonies immunophenotyped by double staining with TER-119/2D5 (E/Mk markers) and c-kit/CD34 (mast cell markers) antibodies is presented. Cells pooled from BFU-E–derived colonies grown in the corresponding cultures from normal mice (WT-BFU-E) were immunophenotyped in parallel with the same antibodies for comparison. RI and RII indicate regions of the dot plots corresponding to the antigenic profile c-kitlow CD34low and c-kithigh CD34high, characteristic of progenitor cells (reference 52) and mast cells, respectively. Negative controls were represented by cells stained with appropriate isotype matched irrelevant antibodies (not depicted). Similar results were obtained in three independent experiments.
Figure 6.
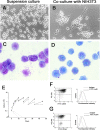
Defective maturation of mast cell precursors in vitro in CFU-EMkMc–derived colonies. Phase contrast microscopic observation (A and B) and May-Grunwald/Giemsa staining (C and D) of CFU-EMkMc–derived cells grown for 2 wk either in suspension or on fibroblast feeder layer (on the left and right panels, as indicated) in the presence of SCF and IL-3. ×100 in both. (E) The growth curves of CFU-EMkMc–derived cells (straight lines) grown for up to 45 d in cultures stimulated with SCF and IL-3 either in suspension culture (▪) or on a fibroblast underlayer (▿) are presented. The vertical dotted lines indicate weekly demipopulations. The growth curves of cells pooled from BFU-E– (green circles) and CFU-GM (red circles)–derived colonies obtained from cultures of normal mice (dashed lines) and grown in parallel under the same conditions described above are also presented as controls. The results are presented as the mean (±SD) of at least three separate experiments. FACS® analysis for double expression of c-kit/CD34 (dot plots) and FcɛRI (histograms) of CFU-EMkMc–derived cells grown for 2 wk in suspension culture (F) or on a fibroblast underlayer (G) is shown. The cells analyzed for FcɛRI expression had been gated as c-kit+. For convenience, only staining with an irrelevant antibody is shown for the FcɛRI (dotted line) analysis. The c-kit− CD34+ cells present in G were separated by FACS® and identified as contaminating fibroblasts. Similar results were obtained in three additional experiments.
Figure 7.
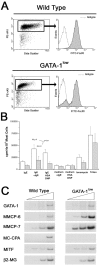
BMMCs obtained from marrow of GATA-1low mice express lower levels of FcɛRI and MC-CPA and release less [3H]serotonin after IgE-αIgE stimulation than the normal cells. (A) FACS® analysis for the expression of c-kit and FcɛRI of BMMC obtained after 21 d of culture under BMMC-specific conditions from normal mice and their GATA-1low littermates are presented on the top and bottom panels, as indicated. Dot plots for side scatter and c-kit expression and histograms for FcɛRI expression of the c-kithigh gated cells are presented on the left and right, respectively. Negative controls were represented by cells labeled with an irrelevant isotype-matched antibody and for convenience are only presented for the FcɛRI analysis. The results are representative of those obtained in five separate experiments (each one started with cells harvested from a different animal). (B) Level of serotonin (as cpm/105 cells) released upon IgE-αIgE stimulation by BMMC obtained after 21 d of culture under specific culture conditions from GATA-1low mice (gray bars) and their normal littermates (open bars). Positive and negative controls were represented by cells stimulated with IgE alone, medium plus αIgE, and medium, human serum albumin, DNP, and Ionomycin, as indicated. The levels of total serotonin that had been incorporated by the cells was measured by lysing the BMMC in Triton X-100. The results are presented as the mean (±SD) of at least five separate experiments performed in duplicate. (C) Semiquantitative RT-PCR analysis for the expression of β2 microglobulin (β2-MG), GATA-1, GATA-2, MITF, MMCP6, MMCP7, and MC-CPA genes in cells obtained after 21 d under BMMC-specific culture conditions. Each product was amplified for an increasing number of cycles (20, 25, 30, and 35), as indicated by the triangle on the top of the panel. Similar results were obtained in two additional experiments.
Figure 8.
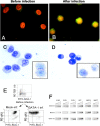
Infection of GATA-1low BMMC with the PGK-GATA-1 retrovirus increases the level of GATA-1 expression and restores in vitro maturation potential. (A and B) GATA-1–specific immunofluorescent staining of BMMC either before or 17 d after their coculture with the PGK-GATA-1–producing cell line, as indicated. Cell nuclei are counterstained with DAPI. (C and D) Alcian blue staining of the same cells shown above. Toluidine blue staining of representative cells are presented in the inserts. ×100 in all of the cases. (E) Immunophenotype of day 7 BMMC before infection and 17 d after the 48-h coculture with either NIH 3T3 (Mock-inf.) or the PGK-GATA-1–producing cell line (GATA-1 inf.). Day 7 BMMC were immunophenotyped with TER-119/SCA-1 whereas cocultured BMMC were immunophenotyped with c-Kit/Sca-1. (F) Semiquantitative RT-PCR analysis for the expression of β2 microglobulin (β2-MG, positive control), GATA-1, GATA-2, MITF, MMCP6, and MMCP7 genes in cells obtained after 7 d under BMMC-specific culture conditions (before infection) or 17 d after the BMMC had been cocultured with either NIH 3T3 (Mock inf.) or the PGK-GATA-1–producing cell line (GATA-1 inf.; the same cells as presented above). Each product was amplified for an increasing number of cycles (20, 25, 30, and 35), as indicated by the triangle on the top of the panel. Similar results were obtained in two additional experiments.
Similar articles
- Molecular heterogeneity of regulatory elements of the mouse GATA-1 gene.
Ronchi A, Cirò M, Cairns L, Basilico L, Corbella P, Ricciardi-Castagnoli P, Cross M, Ghysdael J, Ottolenghi S. Ronchi A, et al. Genes Funct. 1997 Nov;1(4):245-58. doi: 10.1046/j.1365-4624.1997.00021.x. Genes Funct. 1997. PMID: 9678901 - Differential context-dependent effects of friend of GATA-1 (FOG-1) on mast-cell development and differentiation.
Sugiyama D, Tanaka M, Kitajima K, Zheng J, Yen H, Murotani T, Yamatodani A, Nakano T. Sugiyama D, et al. Blood. 2008 Feb 15;111(4):1924-32. doi: 10.1182/blood-2007-08-104489. Epub 2007 Dec 6. Blood. 2008. PMID: 18063754 - GATA-Dependent expression of the interleukin-1 receptor-related T1 gene in mast cells.
Gächter T, Moritz DR, Gheyselinck J, Klemenz R. Gächter T, et al. Mol Cell Biol. 1998 Sep;18(9):5320-31. doi: 10.1128/MCB.18.9.5320. Mol Cell Biol. 1998. PMID: 9710616 Free PMC article. - mi-transcription factor as a regulator of mast cell differentiation.
Kitamura Y, Morii E, Jippo T, Ito A. Kitamura Y, et al. Int J Hematol. 2000 Apr;71(3):197-202. Int J Hematol. 2000. PMID: 10846823 Review. - Rescue of erythroid development in gene targeted GATA-1- mouse embryonic stem cells.
Simon MC, Pevny L, Wiles MV, Keller G, Costantini F, Orkin SH. Simon MC, et al. Nat Genet. 1992 May;1(2):92-8. doi: 10.1038/ng0592-92. Nat Genet. 1992. PMID: 1302015 Review.
Cited by
- GATA factor mutations in hematologic disease.
Crispino JD, Horwitz MS. Crispino JD, et al. Blood. 2017 Apr 13;129(15):2103-2110. doi: 10.1182/blood-2016-09-687889. Epub 2017 Feb 8. Blood. 2017. PMID: 28179280 Free PMC article. Review. - Eosinophils and mast cells: a lineage apart.
Sarrazin S, Sieweke MH. Sarrazin S, et al. Nat Immunol. 2016 May 19;17(6):609-11. doi: 10.1038/ni.3446. Nat Immunol. 2016. PMID: 27196510 No abstract available. - The CXCR1/CXCR2 Inhibitor Reparixin Alters the Development of Myelofibrosis in the Gata1 low Mice.
Verachi P, Gobbo F, Martelli F, Martinelli A, Sarli G, Dunbar A, Levine RL, Hoffman R, Massucci MT, Brandolini L, Giorgio C, Allegretti M, Migliaccio AR. Verachi P, et al. Front Oncol. 2022 Mar 22;12:853484. doi: 10.3389/fonc.2022.853484. eCollection 2022. Front Oncol. 2022. PMID: 35392239 Free PMC article. - Repression of c-kit and its downstream substrates by GATA-1 inhibits cell proliferation during erythroid maturation.
Munugalavadla V, Dore LC, Tan BL, Hong L, Vishnu M, Weiss MJ, Kapur R. Munugalavadla V, et al. Mol Cell Biol. 2005 Aug;25(15):6747-59. doi: 10.1128/MCB.25.15.6747-6759.2005. Mol Cell Biol. 2005. PMID: 16024808 Free PMC article. - Mechanism governing heme synthesis reveals a GATA factor/heme circuit that controls differentiation.
Tanimura N, Miller E, Igarashi K, Yang D, Burstyn JN, Dewey CN, Bresnick EH. Tanimura N, et al. EMBO Rep. 2016 Feb;17(2):249-65. doi: 10.15252/embr.201541465. Epub 2015 Dec 23. EMBO Rep. 2016. PMID: 26698166 Free PMC article.
References
- Costa, J.J., P.F. Weller, and S.J. Galli. 1997. The cells of the allergic response: mast cells, basophils, and eosinophils. JAMA. 278:1815–1822. - PubMed
- Kitamura, Y., M. Yokoyama, H. Matsuda, T. Ohno, and K.J. Mori. 1981. Spleen colony-forming cell as common precursor for tissue mast cells and granulocytes. Nature. 291:159–160. - PubMed
- Kirshenbaum, A.S., J.P. Goff, T. Semere, B. Foster, L.M. Scott, and D.D. Metcalfe. 1999. Demonstration that human mast cells arise from a progenitor cell population that is CD34+, c-kit+, and expresses aminopeptidase N (CD13). Blood. 94:2333–2342. - PubMed
- Rodewald, H.R., M. Dessing, A.M. Dvorak, and S.J. Galli. 1996. Identification of a committed precursor for the mast cell lineage. Science. 271:818–822. - PubMed
Publication types
MeSH terms
Substances
LinkOut - more resources
Full Text Sources
Other Literature Sources
Molecular Biology Databases
