Activation of dendritic cells through the interleukin 1 receptor 1 is critical for the induction of autoimmune myocarditis - PubMed (original) (raw)
Activation of dendritic cells through the interleukin 1 receptor 1 is critical for the induction of autoimmune myocarditis
Urs Eriksson et al. J Exp Med. 2003.
Abstract
Dilated cardiomyopathy, resulting from myocarditis, is the most common cause of heart failure in young patients. We here show that interleukin (IL)-1 receptor type 1-deficient (IL-1R1(-/-)) mice are protected from development of autoimmune myocarditis after immunization with alpha-myosin-peptide(614-629). CD4(+) T cells from immunized IL-1R1(-/-) mice proliferated poorly and failed to transfer disease after injection into naive severe combined immunodeficiency (SCID) mice. In vitro stimulation experiments suggested that the function of IL-1R1(-/-)CD4(+) T cells was not intrinsically defect, but their activation by dendritic cells was impaired in IL-1R1(-/-) mice. Accordingly, production of tumor necrosis factor (TNF)-alpha, IL-1, IL-6, and IL-12p70 was reduced in dendritic cells lacking the IL-1 receptor type 1. In fact, injection of immature, antigen-loaded IL-1R1(+/+) but not IL-1R1(-/-) dendritic cells into IL-1R1(-/-) mice fully restored disease susceptibility by rendering IL-1R1(-/-) CD4(+) T cells pathogenic. Thus, IL-1R1 triggering is required for efficient activation of dendritic cells, which is in turn a prerequisite for induction of autoreactive CD4(+) T cells and autoimmunity.
Figures
Figure 1.
IL-1R1−/− mice are protected from autoimmune myocarditis and rendered susceptible by transfer of IL-1R1+/+ DCs. (A and B) Mice were immunized with myhc-α and hearts were evaluated at day 21. Inflammatory infiltrates are present in hearts of IL-1R1+/+ (A) but not IL-1R1−/− mice (B). (C and D) IL-1R1−/− mice were reconstituted with immature myhc-α–pulsed bone marrow DCs derived from naive IL-1R1+/+ mice (wt-DC→ ko-mice) (C) or IL-1R1−/− mice (ko-DC→ ko-mice) (D) before immunization with myhc-α. Myocarditis is seen in wt-DC → ko-mice (C) but not in ko-DC → ko-mice (D). (E and F) CD4+ T cells purified at day 21 after immunization of mice described in C and D were restimulated in vitro with myhc-α for 48 h before transfer into naive IL-1R1+/+ SCID (BALB/c) recipients. At day 10 after adoptive transfer, unimmunized SCID mice develop myocarditis by transfer of IL-1R1−/− CD4+ T cells isolated from wt-DC → ko-mice (E) but not from ko-DC → ko-mice (F). 480× original magnification.
Figure 2.
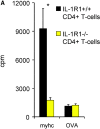
Reduced CD4+ T cell responses in immunized IL-1R1−/− mice. Groups of mice were immunized with myhc-α and CD4+ T cells were isolated 21 d later and restimulated with 10 μg/ml myhc-α in vitro. (A) Proliferation was measured by [3H]-thymidine incorporation after 48 h. Values indicate means (± SD) of three individual mice. *P = 0.036 for antigen restimulated IL-1R1−/− vs. IL-1R1+/+ CD4+ T cells (analysis of variance [ANOVA] and unpaired t test). (B) Cytokines in the supernatant were measured by ELISA after 40 h of restimulation with specific myhc-α antigen. Values indicate means (± SD) of 4–5 individual mice. *P = 0.0037 for IL-2, and P < 0.0001 for IFN-γ production of IL-1R1−/− vs. IL-1R1+/+ CD4+ T cells. P values were calculated using ANOVA and the unpaired t test. (C) CD4+ CD62L+ T cells were purified from naive mice by MACS and stimulated with (i) soluble anti-CD3ɛ (5 μg/ml), (ii) anti-CD3ɛ (5 μg/ml) and anti-CD28 (1 μg/ml), (iii) PMA (50 ng/ml) and Ionomycin (500 ng/ml), or (iv) with Concanavalin A (1 μg/ml) together with 0.25 × 10⁵ unstimulated DCs. Proliferation was measured after 48 h of culture with the indicated stimuli. *P < 0.0001 for both, IL-1R1+/+ and IL-1R1−/− DCs. P values were calculated using ANOVA and the unpaired t test. Values are expressed as mean (±SD) of five different mice. (D) Con A induced proliferation of IL-1R+/+CD4+ T cells on irradiated splenocytes (APC) in the presence of increasing numbers of either IL-1R1+/+ (black bars) or IL-1R1−/− (yellow bars) DCs. One out of four representative experiments is shown. Values are expressed as mean (±SD) of four culture wells.
Figure 3.
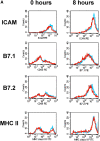
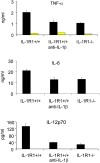
Up-regulation of costimulatory molecules and production of proinflammatory cytokines in IL-1R1+/+ and IL-1R1−/− DCs. (A) FACS® profiles representing only minimal differences in the expression of costimulatory molecules on IL-1R1+/+ (blue) and IL-1R1−/− (red) DCs before and after stimulation with LPS/anti-CD40 for 8 h. Histogramms were gated on CD11c+MHC class II+ live cells (ICAM, B7.1, B7.2) or CD11c+ live cells. (B) Mature BM-DCs were stimulated for 24 h as indicated. IL-12p70, TNF-α, IL-6, and IL-1β were measured by ELISA. Data for IL-1R1+/+ DCs (black bars) and IL-1R1−/− DCs (yellow bars) are expressed as mean (±SD) from quadruplicate culture wells. Differences between IL-1R1+/+ and IL-1R1−/− DCs were highly significant for all cytokines following LPS, or LPS/anti-CD40 stimulation. IL-1R1−/− DCs also produced significantly reduced levels of TNF-α, IL-1β, and IL-6 after stimulation with anti-CD40 alone, significantly reduced levels of IL-6 and IL-1β after TNF-α stimulation, and significantly reduced TNF-α levels after IL-1β stimulation. (All P values 0.0001 or <0.0001, following ANOVA and unpaired t test). The data are representative for several independent experiments with similar results.
Figure 4.
Neutralization of IL-1β reduces production of proinflammatory cytokines by BM-DCs. Mature bone marrow–derived IL-1R1+/+ and IL-1R1−/− DCs were cultured for 24 h in the presence or absence of an anti–IL-1β antibody. Cytokines were detected by ELISA. Data for CD40/LPS stimulated DCs (black bars) and nonstimulated DCs (yellow bars) are expressed as mean (±SD) from triplicate culture wells.
Similar articles
- Interleukin-6-deficient mice resist development of autoimmune myocarditis associated with impaired upregulation of complement C3.
Eriksson U, Kurrer MO, Schmitz N, Marsch SC, Fontana A, Eugster HP, Kopf M. Eriksson U, et al. Circulation. 2003 Jan 21;107(2):320-5. doi: 10.1161/01.cir.0000043802.38699.66. Circulation. 2003. PMID: 12538435 - Dendritic cell-induced autoimmune heart failure requires cooperation between adaptive and innate immunity.
Eriksson U, Ricci R, Hunziker L, Kurrer MO, Oudit GY, Watts TH, Sonderegger I, Bachmaier K, Kopf M, Penninger JM. Eriksson U, et al. Nat Med. 2003 Dec;9(12):1484-90. doi: 10.1038/nm960. Epub 2003 Nov 16. Nat Med. 2003. PMID: 14625544 - Innate signaling promotes formation of regulatory nitric oxide-producing dendritic cells limiting T-cell expansion in experimental autoimmune myocarditis.
Kania G, Siegert S, Behnke S, Prados-Rosales R, Casadevall A, Lüscher TF, Luther SA, Kopf M, Eriksson U, Blyszczuk P. Kania G, et al. Circulation. 2013 Jun 11;127(23):2285-94. doi: 10.1161/CIRCULATIONAHA.112.000434. Epub 2013 May 13. Circulation. 2013. PMID: 23671208 - Pathogenesis of myocarditis and dilated cardiomyopathy.
Cihakova D, Rose NR. Cihakova D, et al. Adv Immunol. 2008;99:95-114. doi: 10.1016/S0065-2776(08)00604-4. Adv Immunol. 2008. PMID: 19117533 Review. - Dendritic cells and autoimmune heart failure.
Marty RR, Eriksson U. Marty RR, et al. Int J Cardiol. 2006 Sep 10;112(1):34-9. doi: 10.1016/j.ijcard.2006.06.022. Epub 2006 Aug 7. Int J Cardiol. 2006. PMID: 16891018 Review.
Cited by
- 4E-BP3 deficiency impairs dendritic cell activation and CD4+ T cell differentiation and attenuates α-myosin-specific T cell-mediated myocarditis in mice.
Li S, Tajiri K, Yuan Z, Murakata Y, Song Z, Mizuno S, Xu D, Murakoshi N. Li S, et al. Basic Res Cardiol. 2024 Nov 9. doi: 10.1007/s00395-024-01089-3. Online ahead of print. Basic Res Cardiol. 2024. PMID: 39516410 - Mitochondrial extracellular vesicles, autoimmunity and myocarditis.
Di Florio DN, Beetler DJ, McCabe EJ, Sin J, Ikezu T, Fairweather D. Di Florio DN, et al. Front Immunol. 2024 Mar 14;15:1374796. doi: 10.3389/fimmu.2024.1374796. eCollection 2024. Front Immunol. 2024. PMID: 38550582 Free PMC article. Review. - Innate and adaptive immunity in acute myocarditis.
Golino M, Harding D, Del Buono MG, Fanti S, Mohiddin S, Toldo S, Smyth J, Sanna T, Marelli-Berg F, Abbate A. Golino M, et al. Int J Cardiol. 2024 Jun 1;404:131901. doi: 10.1016/j.ijcard.2024.131901. Epub 2024 Feb 23. Int J Cardiol. 2024. PMID: 38403204 Review. - Lrig1-expression confers suppressive function to CD4+ cells and is essential for averting autoimmunity via the Smad2/3/Foxp3 axis.
Moon JS, Ho CC, Park JH, Park K, Shin BY, Lee SH, Sequeira I, Mun CH, Shin JS, Kim JH, Kim BS, Noh JW, Lee ES, Son JY, Kim Y, Lee Y, Cho H, So S, Park J, Choi E, Oh JW, Lee SW, Morio T, Watt FM, Seong RH, Lee SK. Moon JS, et al. Nat Commun. 2023 Sep 4;14(1):5382. doi: 10.1038/s41467-023-40986-4. Nat Commun. 2023. PMID: 37666819 Free PMC article. - Sex differences in coronavirus disease 2019 myocarditis.
Beetler DJ, Fairweather D. Beetler DJ, et al. Curr Opin Physiol. 2023 Oct;35:100704. doi: 10.1016/j.cophys.2023.100704. Epub 2023 Jul 21. Curr Opin Physiol. 2023. PMID: 37662585 Free PMC article.
References
- Martino, T.A., P. Liu, and M.J. Sole. 1994. Viral infection and the pathogenesis of dilated cardiomyopathy. Circ. Res. 74:182–188. - PubMed
- Batra, A.S., and A.B. Lewis. 2001. Acute myocarditis. Curr. Opin. Pediatr. 13:234–239. - PubMed
- Smith, S.C., and P.M. Allen. 1991. Myosin-induced acute myocarditis is a T cell-mediated disease. J. Immunol. 147:2141–2147. - PubMed
Publication types
MeSH terms
Substances
LinkOut - more resources
Full Text Sources
Other Literature Sources
Medical
Molecular Biology Databases
Research Materials


