HIV protease inhibitors promote atherosclerotic lesion formation independent of dyslipidemia by increasing CD36-dependent cholesteryl ester accumulation in macrophages - PubMed (original) (raw)
. 2003 Feb;111(3):389-97.
doi: 10.1172/JCI16261.
Jeanie Kincer, Sergey V Matveev, Ling Guo, Richard N Greenberg, Theresa Guerin, David Meade, Xiang-An Li, Weifei Zhu, Annette Uittenbogaard, Melinda E Wilson, Eric J Smart
Affiliations
- PMID: 12569165
- PMCID: PMC151854
- DOI: 10.1172/JCI16261
HIV protease inhibitors promote atherosclerotic lesion formation independent of dyslipidemia by increasing CD36-dependent cholesteryl ester accumulation in macrophages
James Dressman et al. J Clin Invest. 2003 Feb.
Abstract
Protease inhibitors decrease the viral load in HIV patients, however the patients develop hypertriglyceridemia, hypercholesterolemia, and atherosclerosis. It has been assumed that protease inhibitor-dependent increases in atherosclerosis are secondary to the dyslipidemia. Incubation of THP-1 cells or human PBMCs with protease inhibitors caused upregulation of CD36 and the accumulation of cholesteryl esters. The use of CD36-blocking antibodies, a CD36 morpholino, and monocytes isolated from CD36 null mice demonstrated that protease inhibitor-induced increases in cholesteryl esters were dependent on CD36 upregulation. These data led to the hypothesis that protease inhibitors induce foam cell formation and consequently atherosclerosis by upregulating CD36 and cholesteryl ester accumulation independent of dyslipidemia. Studies with LDL receptor null mice demonstrated that low doses of protease inhibitors induce an increase in the level of CD36 and cholesteryl ester in peritoneal macrophages and the development of atherosclerosis without altering plasma lipids. Furthermore, the lack of CD36 protected the animals from protease inhibitor-induced atherosclerosis. Finally, ritonavir increased PPAR-gamma and CD36 mRNA levels in a PKC- and PPAR-gamma-dependent manner. We conclude that protease inhibitors contribute to the formation of atherosclerosis by promoting the upregulation of CD36 and the subsequent accumulation of sterol in macrophages.
Figures
Figure 1
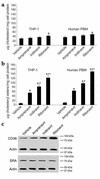
HIV protease inhibitors induce the accumulation of cholesteryl ester in THP-1 macrophages and human PBMCs. The human monocyte/macrophage cell line, THP-1, was cultured in 100 nM PMA for 72 hours to promote attachment and differentiation of the cells to a macrophage phenotype. In addition, we used freshly isolated and cultured human PBMCs (37) in these studies. The cells were incubated in the presence of 10% serum and 50 μg/ml of aggregated LDL along with 30 ng/ml of amprenavir, indinavir, ritonavir, or vehicle (ethanol) for 24 hours. The cells were lysed, lipids extracted, and processed to quantify total cellular cholesterol (a) or total cellular cholesteryl ester (b) by gas chromatography. Bars represent mean ± SE, n = 4 with triplicate measurements. *P < 0.01 compared with vehicle, #P < 0.01 compared with amprenavir, +P < 0.01 compared with indinavir. (c) THP-1 cells were lysed and 20 μg of protein was resolved by SDS-PAGE and immunoblotted with antibodies for CD36, SRA, and actin. Cross-reactive material was visualized by chemiluminescence. The exposure time was 2 minutes. The data are representative of five independent experiments. Essentially identical immunoblots were generated with human PBMCs (data not shown).
Figure 2
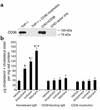
CD36 blocking antibodies and a CD36 morpholino prevent the accumulation of sterol. (a) THP-1 cells were cultured in 100 nM PMA for 72 hours to promote attachment and differentiation of the cells to a macrophage phenotype and then treated with 25 nmol of a CD36 morpholino for 24 hours. The THP-1 cells and CHO cells expressing human CD36 (hCD36) or the vector only were lysed and 20 μg of protein was resolved by SDS-PAGE and immunoblotted with the CD36 blocking antibody. Cross-reactive material was visualized by chemiluminescence. The exposure time was 2 minutes. The data are representative of three independent experiments. (b) THP-1 cells were cultured in 100 nM PMA for 72 hours to promote attachment and differentiation of the cells to a macrophage phenotype. The cells were incubated in the presence of 10% serum and 50 μg/ml of aggregated LDL, along with 30 ng/ml of amprenavir, indinavir, ritonavir, or vehicle (ethanol) for 24 hours. In addition, different sets of cells also contained one of the following: 20 μg/ml of CD36 blocking IgM, 20 μg/ml nonrelevant IgM, or a CD36 morpholino (25 nmol). After the treatment period, the cells were lysed, lipids extracted, and processed to quantify total cellular cholesterol and cholesteryl esters by gas chromatography. Bars represent mean ± SE, n = 5 with triplicate measurements. *P < 0.01 compared with vehicle, +P < 0.01 compared with amprenavir, #P < 0.01 compared with indinavir.
Figure 3
Ritonavir does not induce sterol accumulation in peritoneal macrophages isolated from CD36 null mice. Peritoneal macrophages were isolated from the indicated mouse strains and then incubated in the presence of 10% serum and 50 μg/ml of aggregated LDL, along with 30 ng/ml of ritonavir or vehicle (0.01% ethanol) for 24 hours. After the treatment period the cells were lysed, lipids extracted, and processed to quantify total cellular cholesterol and cholesteryl esters by gas chromatography. Bars represent mean ± SE, n = 3 with triplicate measurements. *P < 0.01 compared with vehicle.
Figure 4
Effect of HIV protease inhibitors on plasma lipids. Six-week-old male LDLR null mice on a chow diet were given vehicle control (0.01% ethanol) or the following protease inhibitors in their drinking water: amprenavir (23 or 75 μg/mouse/day), indinavir (25 or 75 μg/mouse/day), or ritonavir (10 or 50 μg/mouse/day). The total plasma triglyceride (a) and cholesterol/cholesteryl ester (b) levels were determined after 0, 4, and 8 weeks of treatment with a commercial kit (Wako Chemicals USA Inc.) or gas chromatography. Bars represent mean ± SE, n = 8. *P < 0.01 compared with vehicle. White bars are vehicle controls, black bars are low-dose protease inhibitors, and gray bars are high-dose protease inhibitors.
Figure 5
HIV protease inhibitors induce an increase in peritoneal macrophage cholesterol/cholesteryl ester levels. Six-week-old male LDLR null mice on a chow diet were given vehicle control (0.01% ethanol) or the following protease inhibitors in their drinking water: amprenavir (23 or 75 μg/mouse/day), indinavir (25 or 75 μg/mouse/day), or ritonavir (10 or 50 μg/mouse/day). After 8 weeks of treatment, peritoneal macrophages were isolated and cholesterol/cholesteryl ester mass was determined by gas chromatography. Bars represent mean ± SE, n = 8. *P < 0.01 compared with vehicle, #P < 0.01 compared with low dose of the same protease inhibitor.
Figure 6
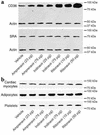
HIV protease inhibitors induce an increase of CD36 protein levels in peritoneal macrophages. Six-week-old male LDLR null mice on a chow diet were given vehicle control (0.01% ethanol) or the following protease inhibitors in their drinking water: amprenavir (23 or 75 μg/mouse/day), indinavir (25 or 75 μg/mouse/day), or ritonavir (10 or 50 μg/mouse/day). (a) After 8 weeks of treatment, peritoneal macrophages were isolated, the cells were lysed, and 20 μg of protein was resolved by SDS-PAGE and immunoblotted with antibodies for CD36, SRA, and actin. The data are representative of eight mice. (b) After 8 weeks of treatment, cardiac myocytes (38), adipocytes (39), and platelets (40) were isolated, the cells were lysed, and 20 μg of protein was resolved by SDS-PAGE and immunoblotted with antibodies against CD36. The data are representative of eight mice.
Figure 7
HIV protease inhibitors induced the formation of atherosclerotic lesions in LDLR null mice. Six-week-old male LDLR null mice on a chow diet were given vehicle control (0.01% ethanol) or the following protease inhibitors in their drinking water: amprenavir (23 or 75 μg/mouse/day), indinavir (25 or 75 μg/mouse/day), or ritonavir (10 or 50 μg/mouse/day). These mice were then used to quantify the surface area of atherosclerotic lesions. To quantify lesions, we first removed the aorta from the arch to the ileal bifurcation and dissected away extraneous tissue. The intimal surfaces were exposed by a longitudinal cut. The aortas were placed under a dissecting microscope equipped with a video camera attachment that captures the image in a computer file. Atherosclerotic lesions on the intimal aortic surface appear as bright white areas compared with the thin and translucent aorta. Areas of intima covered by atherosclerotic lesions were quantified with ImagePro software. This software analyzes differences in contrast to identify areas covered by lesions. Bars represent mean ± SE, n = 8. *P < 0.01 compared with vehicle, #P < 0.01 compared with low dose of the same protease inhibitor.
Figure 8
Ritonavir did not induce formation of atherosclerotic lesions in apoE × CD36 null mice. Six-week-old male apoE null and apoE × CD36 double null mice were fed a chow diet and given vehicle (0.01% ethanol) or ritonavir (10 μg/mouse/day) in their drinking water for 6 weeks. At the conclusion of the study the extent of atherosclerotic lesions was quantified as above. Data are presented as mean ± SE. n = 12. *P < 0.01 compared with vehicle.
Figure 9
Ritonavir increases CD36 and PPAR-γ mRNA in a PKC-dependent manner. Human PBMCs were incubated in the presence of 10% serum and 50 μg/ml aggregated LDL (agLDL) and/or 30 ng/ml ritonavir as indicated for 24 hours. In addition, some sets of cells were also treated with PMA (100 nM), (diacylglycerol [DAG]; 20 μM), Go6976 (500 nM), calphostin C (200 nM), 15d-PGJ2 (1 μM), or ciglitazone (13 μM). The cells were then lysed, mRNA was isolated, and the relative amounts of CD36, PPAR-γ, and GAPDH mRNA were determined by Northern analysis. Shown are representative data from three independent experiments.
Comment in
- HIV protease inhibitors and atherosclerosis.
Hui DY. Hui DY. J Clin Invest. 2003 Feb;111(3):317-8. doi: 10.1172/JCI17746. J Clin Invest. 2003. PMID: 12569155 Free PMC article. Review. No abstract available.
Similar articles
- Estrogen prevents cholesteryl ester accumulation in macrophages induced by the HIV protease inhibitor ritonavir.
Wilson ME, Sengoku T, Allred KF. Wilson ME, et al. J Cell Biochem. 2008 Apr 1;103(5):1598-606. doi: 10.1002/jcb.21546. J Cell Biochem. 2008. PMID: 17879945 - Nucleoside reverse transcriptase inhibitors prevent HIV protease inhibitor-induced atherosclerosis by ubiquitination and degradation of protein kinase C.
Bradshaw EL, Li XA, Guerin T, Everson WV, Wilson ME, Bruce-Keller AJ, Greenberg RN, Guo L, Ross SA, Smart EJ. Bradshaw EL, et al. Am J Physiol Cell Physiol. 2006 Dec;291(6):C1271-8. doi: 10.1152/ajpcell.00211.2006. Epub 2006 Jul 5. Am J Physiol Cell Physiol. 2006. PMID: 16822947 Retracted. - Enhancement of human ACAT1 gene expression to promote the macrophage-derived foam cell formation by dexamethasone.
Yang L, Yang JB, Chen J, Yu GY, Zhou P, Lei L, Wang ZZ, Cy Chang C, Yang XY, Chang TY, Li BL. Yang L, et al. Cell Res. 2004 Aug;14(4):315-23. doi: 10.1038/sj.cr.7290231. Cell Res. 2004. PMID: 15353128 - CD36 in atherosclerosis. The role of a class B macrophage scavenger receptor.
Nicholson AC, Febbraio M, Han J, Silverstein RL, Hajjar DP. Nicholson AC, et al. Ann N Y Acad Sci. 2000 May;902:128-31; discussion 131-3. Ann N Y Acad Sci. 2000. PMID: 10865832 Review. - Expression of CD36 in macrophages and atherosclerosis: the role of lipid regulation of PPARgamma signaling.
Nicholson AC. Nicholson AC. Trends Cardiovasc Med. 2004 Jan;14(1):8-12. doi: 10.1016/j.tcm.2003.09.004. Trends Cardiovasc Med. 2004. PMID: 14720468 Review.
Cited by
- Incidence and predictors of hypertension in adults with HIV-initiating antiretroviral therapy in south-western Uganda.
Okello S, Kanyesigye M, Muyindike WR, Annex BH, Hunt PW, Haneuse S, Siedner MJ. Okello S, et al. J Hypertens. 2015 Oct;33(10):2039-45. doi: 10.1097/HJH.0000000000000657. J Hypertens. 2015. PMID: 26431192 Free PMC article. - Human immunodeficiency virus protease inhibitors modulate Ca2+ homeostasis and potentiate alcoholic stress and injury in mice and primary mouse and human hepatocytes.
Kao E, Shinohara M, Feng M, Lau MY, Ji C. Kao E, et al. Hepatology. 2012 Aug;56(2):594-604. doi: 10.1002/hep.25702. Epub 2012 Jun 11. Hepatology. 2012. PMID: 22407670 Free PMC article. - IgM colocalises with complement and C reactive protein in infarcted human myocardium.
Krijnen PA, Ciurana C, Cramer T, Hazes T, Meijer CJ, Visser CA, Niessen HW, Hack CE. Krijnen PA, et al. J Clin Pathol. 2005 Apr;58(4):382-8. doi: 10.1136/jcp.2004.022988. J Clin Pathol. 2005. PMID: 15790702 Free PMC article. - Atherosclerosis in subjects newly diagnosed with human immunodeficiency virus infection.
Kirichenko TV, Myasoedova VA, Shimonova TE, Melnichenko AA, Sviridov D, Sobenin IA, Mazus AI, Orekhov AN, Bukrinsky MI. Kirichenko TV, et al. Biosci Rep. 2018 Jul 18;38(4):BSR20180597. doi: 10.1042/BSR20180597. Print 2018 Aug 31. Biosci Rep. 2018. PMID: 29961673 Free PMC article. - Prevention of atherosclerosis in patients living with HIV.
De Lorenzo F, Boffito M, Collot-Teixeira S, Gazzard B, McGregor JL, Shotliff K, Xiao H. De Lorenzo F, et al. Vasc Health Risk Manag. 2009;5(1):287-300. doi: 10.2147/vhrm.s5206. Epub 2009 Apr 8. Vasc Health Risk Manag. 2009. PMID: 19436663 Free PMC article. Clinical Trial.
References
- Periard D, et al. Atherogenic dyslipidemia in HIV-infected individuals treated with protease inhibitors. The Swiss HIV Cohort Study. Circulation. 1999;100:700–705. - PubMed
- Riddle TM, Kuhel DG, Woollett LA, Fichtenbaum CJ, Hui DY. HIV protease inhibitor induces fatty acid and sterol biosynthesis in liver and adipose tissues due to the accumulation of activated sterol regulatory element-binding proteins in the nucleus. J. Biol. Chem. 2001;276:37514–37519. - PubMed
- Wensing AM, Reedijk M, Richter C, Boucher CA, Borleffs JC. Replacing ritonavir by nelfinavir or nelfinavir/saquinavir as part of highly active antiretroviral therapy leads to an improvement of triglyceride levels. AIDS. 2001;15:2191–2193. - PubMed
- Vergis EN, Paterson DL, Wagener MM, Swindells S, Singh N. Dyslipidaemia in HIV-infected patients: association with adherence to potent antiretroviral therapy. Int. J. STD AIDS. 2001;12:463–468. - PubMed
- Stein JH, et al. Use of human immunodeficiency virus-1 protease inhibitors is associated with atherogenic lipoprotein changes and endothelial dysfunction. Circulation. 2001;104:257–262. - PubMed


